Asset Class Returns - 12/31/2024
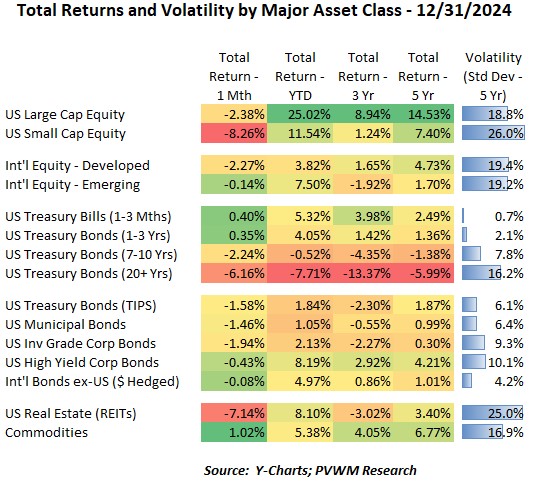
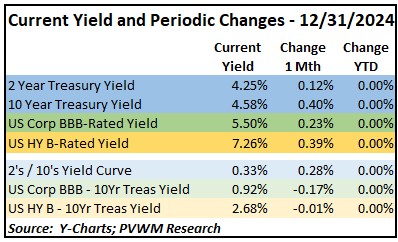
With the exception of shorter maturity Treasuries and Commodities, all major asset classes were down for the last month of the year. For the full 2024 however, only longer-dated Treasuries had negative returns. US Large Caps had spectacular returns for a second year running, clocking in +25% for 2024 after +27% in 2023 (although recall the ugly -20% from 2022!). Having back-to-back returns like this is rare and may not bode well for the next year. The ten largest stocks in the S&P500 now make close to 39% of the total S&P500 market cap (Source: JPM Guide to Markets, see pages 6, 11). US Small Caps saw a large -8.3% drop for December on the back of higher rate concerns, giving back much of the strong November but still left with a very respectable +11.5% YTD. International equities were down slightly for December and just “ok” YTD returns of +3.8% for Developed and +7.5% for Emerging. Note a strong US $ will cause lower returns from international holdings after converting into US terms. In the fixed income market, the yield curve (10-yr minus 2-yr yield) steepened by 28 basis points as the Fed cut rates but inflation is projected to remain higher for longer. The long maturity treasury bond got clocked during December, leaving the YTD return down -7.7%. A quick scan over to the 3yr and 5yr annualized numbers shows you this pain of rising rates for longer maturities has been around for a few years. Know your duration!
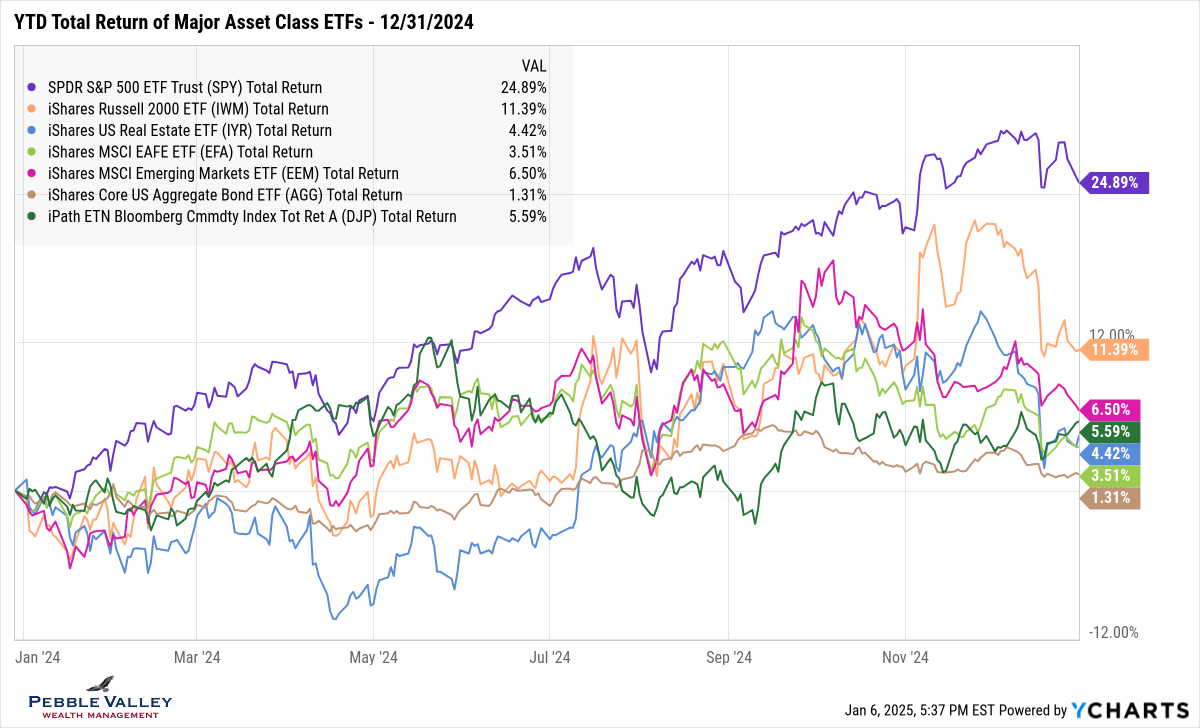
The graph below shows YTD total returns of major asset class ETFs. You will notice the large “camel back” return line of US Small Caps (orange line). The other major drop is seen in REITs (blue line) which were down by a similar amount for the month. The volatile Emerging Markets (magenta line) also stands out given the steady decline after the early October relative peak. The US Aggregate bond index (brown line) ends the year with a small positive return, helped by the extra yield over Treasuries (credit spread) earned throughout the year.
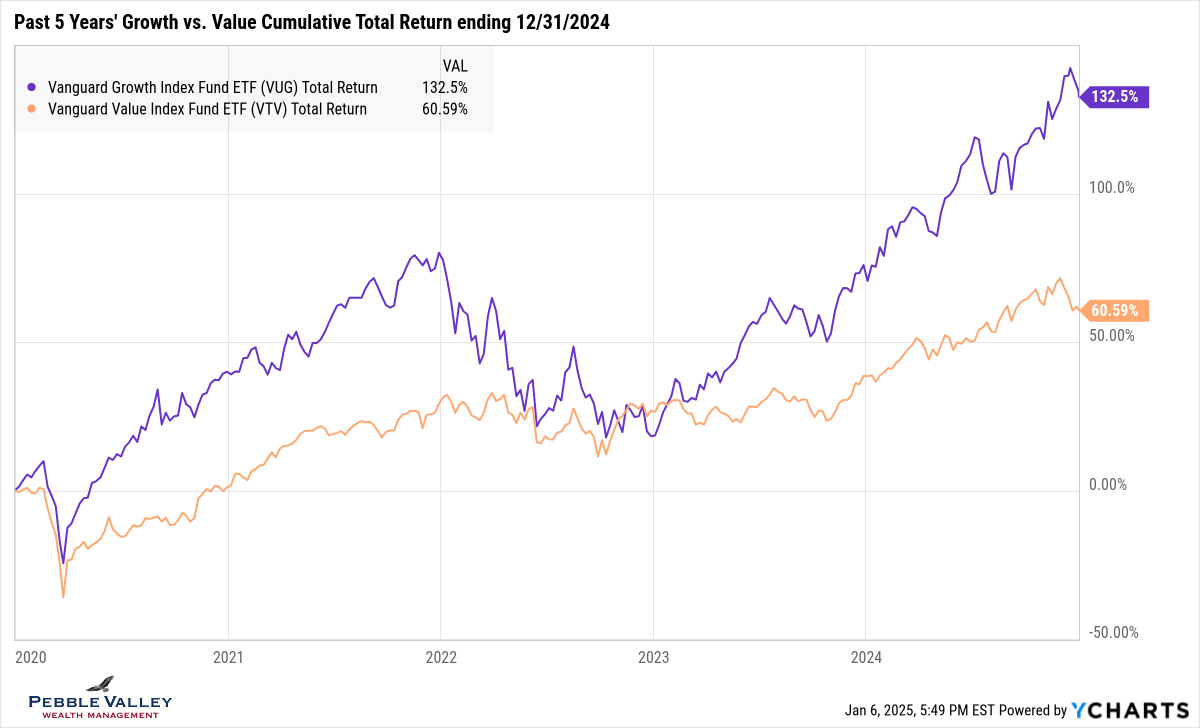
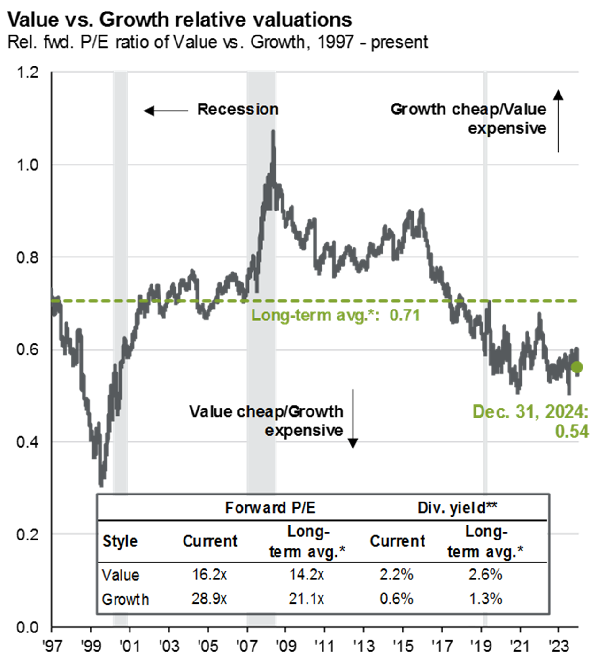
This month I added a Growth vs. Value graph (using Vanguard ETFs). For 2024 alone, the total return outperformance by Growth was about +16% (+32.7% for Growth vs. +15.9% for Value) after having similar YTD returns in early May and again in early August after the “Yen carry” sell-off. You may recall a similar wide dispersion post-COVID in 2020 - 2021 followed by the Growth collapse in 2022. The graph below shows the cumulative total return over the past 5 years. Below that I show the relative valuation of the two back to 1997 from the same JPM Guide to Markets linked above.
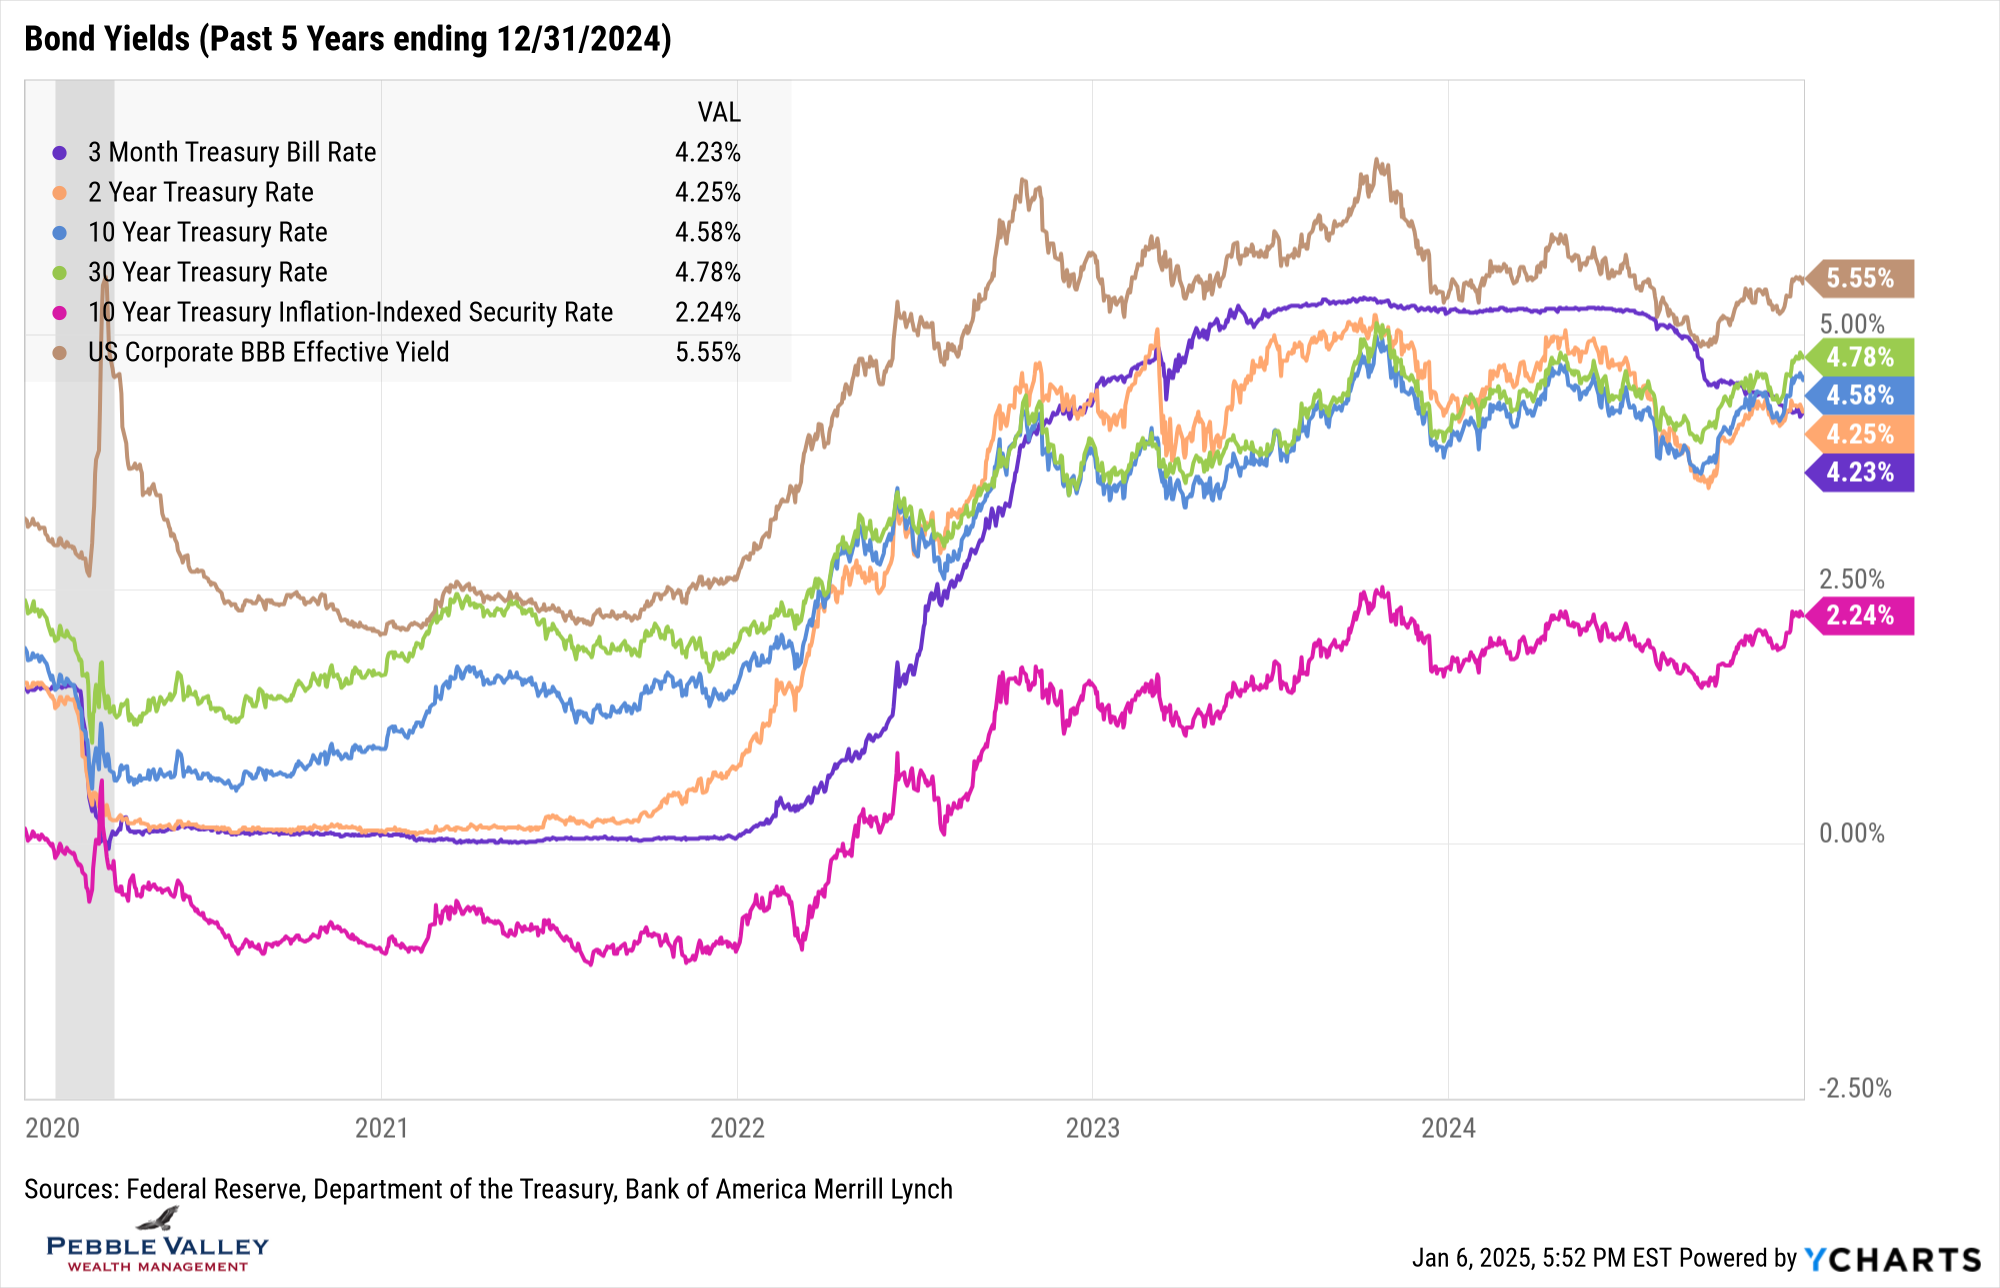
My usual Bond Yield graph is getting interesting again – at least for a bond geek! You can see the longer-term Treasury rates moved up noticeably (blue and green line) but shorter maturity bonds did not – called steepening of the curve – as the Fed cut rates again. You will also see something we have not seen for a couple years – 3-month TBills are now below the 2-year Treasury rate (and other longer maturities). This is a “normal” shape of the yield curve, although still quite flat on the short-end. Continuing in bond-geek mode, investment grade bonds got even tighter, although still higher yield by about half the move as underlying Treasury yield. And the real yield remains – real and ‘yieldy’ – as the Fed’s Dot Plot showed a tick up in long-run Fed Funds rate (see below).
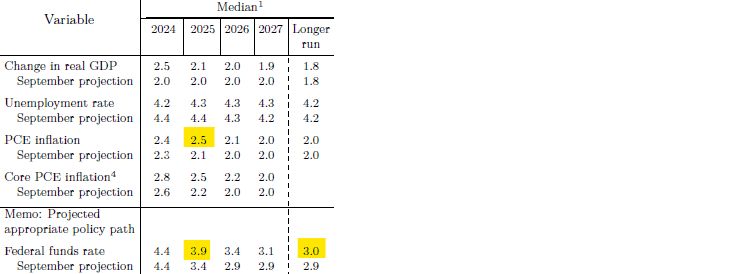
The last FOMC meeting on December 18th delivered as expected with a 0.25% rate cut to 4.25-4.50%. Those with outstanding balances on Home Equity Lines will be happy but not so much for the “TBill and Chill” crowd. The surprise of the meeting came from the updated Summary of Economic Projections relative to the September projections (see table below – Source: Federal Reserve). Expected inflation at the end of 2025 was raised noticeably from 2.1% up to 2.5%. The number of further rate cuts in 2025 was reduced from four 25bps cuts down to two. Real GDP and unemployment rates also projected improvements. And while not a focus each meeting, notice how the longer-run projection of Fed Funds rates ticked up again to 3.0%. What does the market think of all this? According to the CME Fedwatch tool, the market is pricing in 50 / 50 chance of either one or two rate cuts in 2025, down substantially from four or more rate cuts previously. Long maturity bonds are selling off (rates rising) as focus turns back to inflation and US debt issuance.
My special topic this month is the Social Security Fairness Act just signed into law yesterday (1/5/2025). According to SSA.GOV site, this “Act eliminates the reduction of Social Security benefits while entitled to public pensions from work not covered by Social Security. The Social Security Administration is evaluating how to implement the Act. …” and will provide more information soon. At this time no action is needed by those currently receiving a reduced benefit. If you haven’t filed for Social Security in the past because due to receiving a public pension and believe all would have been offset, you may want to consider filing for benefits now. My initial reaction is concern, as there was actuarial justification for these reductions due to lack of contributions by these participants into Social Security and the initial intent of spousal benefits in the program. Recall Social Security currently has a severe underfunding problem and this is moving us further away from fixing as there was no funding offset to these increased benefits. The Congressional Budget Office projects this Act will add $196 billion to deficit over 10 years and bring Social Security shortfall date closer by six months.
Happy New Year! I say it through the month of January if I am seeing a person for the first time in 2025. Apparently Larry David thinks it should be three days!
Have questions? Reach out! We're happy to help.
Posted by Kirk, a fee-only financial advisor who looks at your complete financial picture through the lens of a multi-disciplined, credentialed professional. www.pvwealthmgt.com


