Asset Class Returns - 11/30/2024
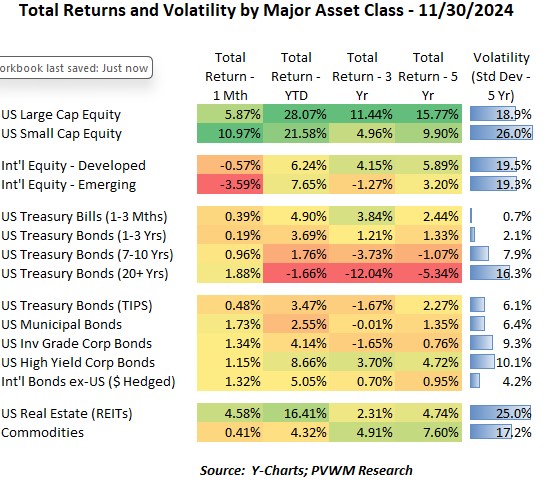
At the start of the month, most markets were relatively flat waiting for the results of the US Election. Once the results were known, it was a tale of two equity markets - US equities ripped higher while international equities moved lower. On the US side, the rally cooled mid-month as rates continued to rise. Before Thanksgiving however, the rally resumed and rates drifted lower. US equities ended the month close to their post-election high. On the international side however, both Developed and Emerging were not able to recover to these levels. Looking at the table above, you can see the green for US equities, especially the monster 11% move for US Small Caps. The resulting Large and Small YTD returns are very high, though Small Caps still have ground to make up if you glance at the 3-year annualized returns. The red pops out for International Emerging, though the YTD returns are close to the Developed markets. Nothing jumps out on the bond asset classes, clocking in a steady return with the 0.11% drop in 10-year Treasury rates. Credit spreads did widen a bit.
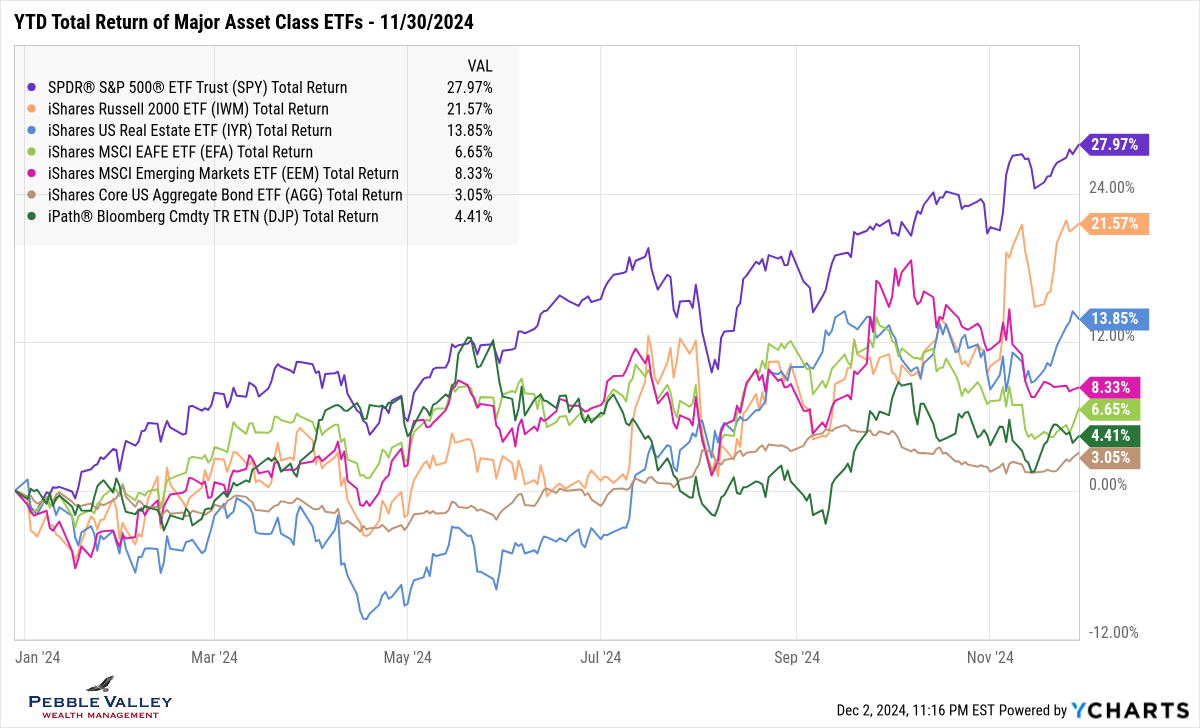
The graph below shows YTD total returns of major asset class ETFs. As discussed above, you can see the US Large and Small Caps had an initial pop post-election, then pulled back temporarily, only to rip higher into month-end. Looking at International equities (Developed – EFA, light green; Emerging – EEM, magenta), you will see a little noise post-election and then a steady grind lower the rest of the month. The US Aggregate bond index (ticker AGG – brown line) rose slightly during the month but continues to hold the distinction of lowest return among the major asset classes – not surprising in a strong rally.
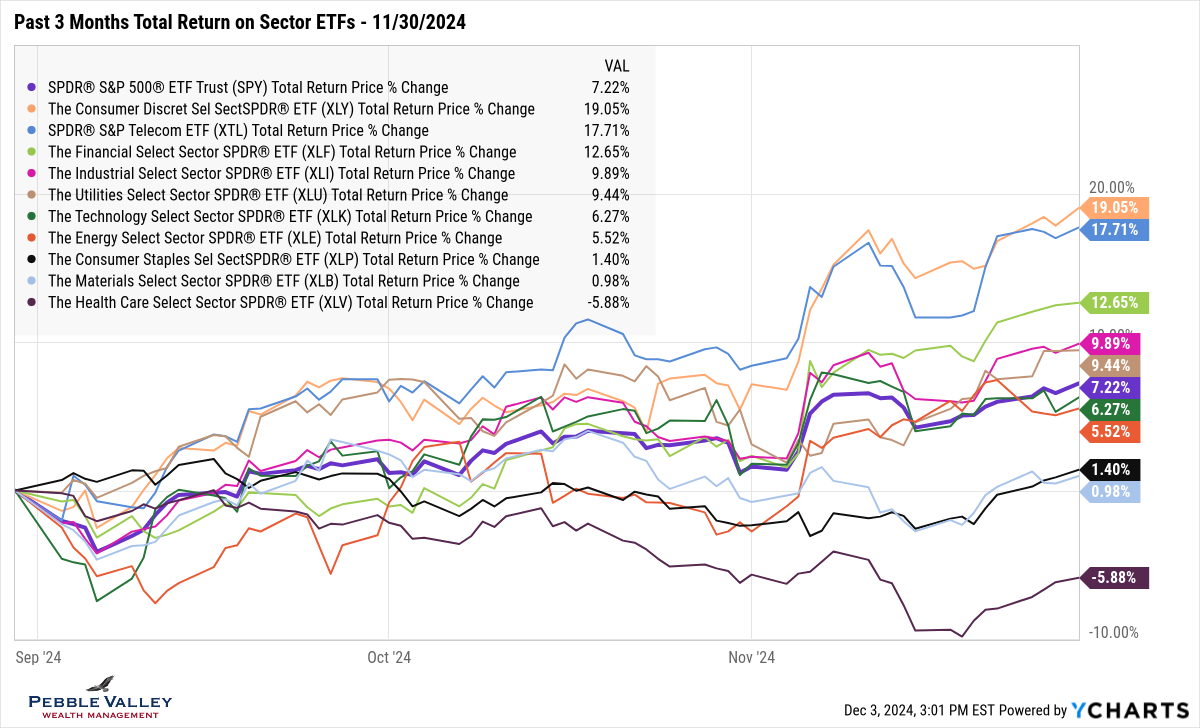
I also added a sector graph showing total returns over the past three months to illustrate sector movement post-election. The thick purple line is the S&P 500. Outperformers for the month were Consumer Discretionary, Financials, Telecom and Energy; laggards were Health Care, Materials and Consumer Staples.
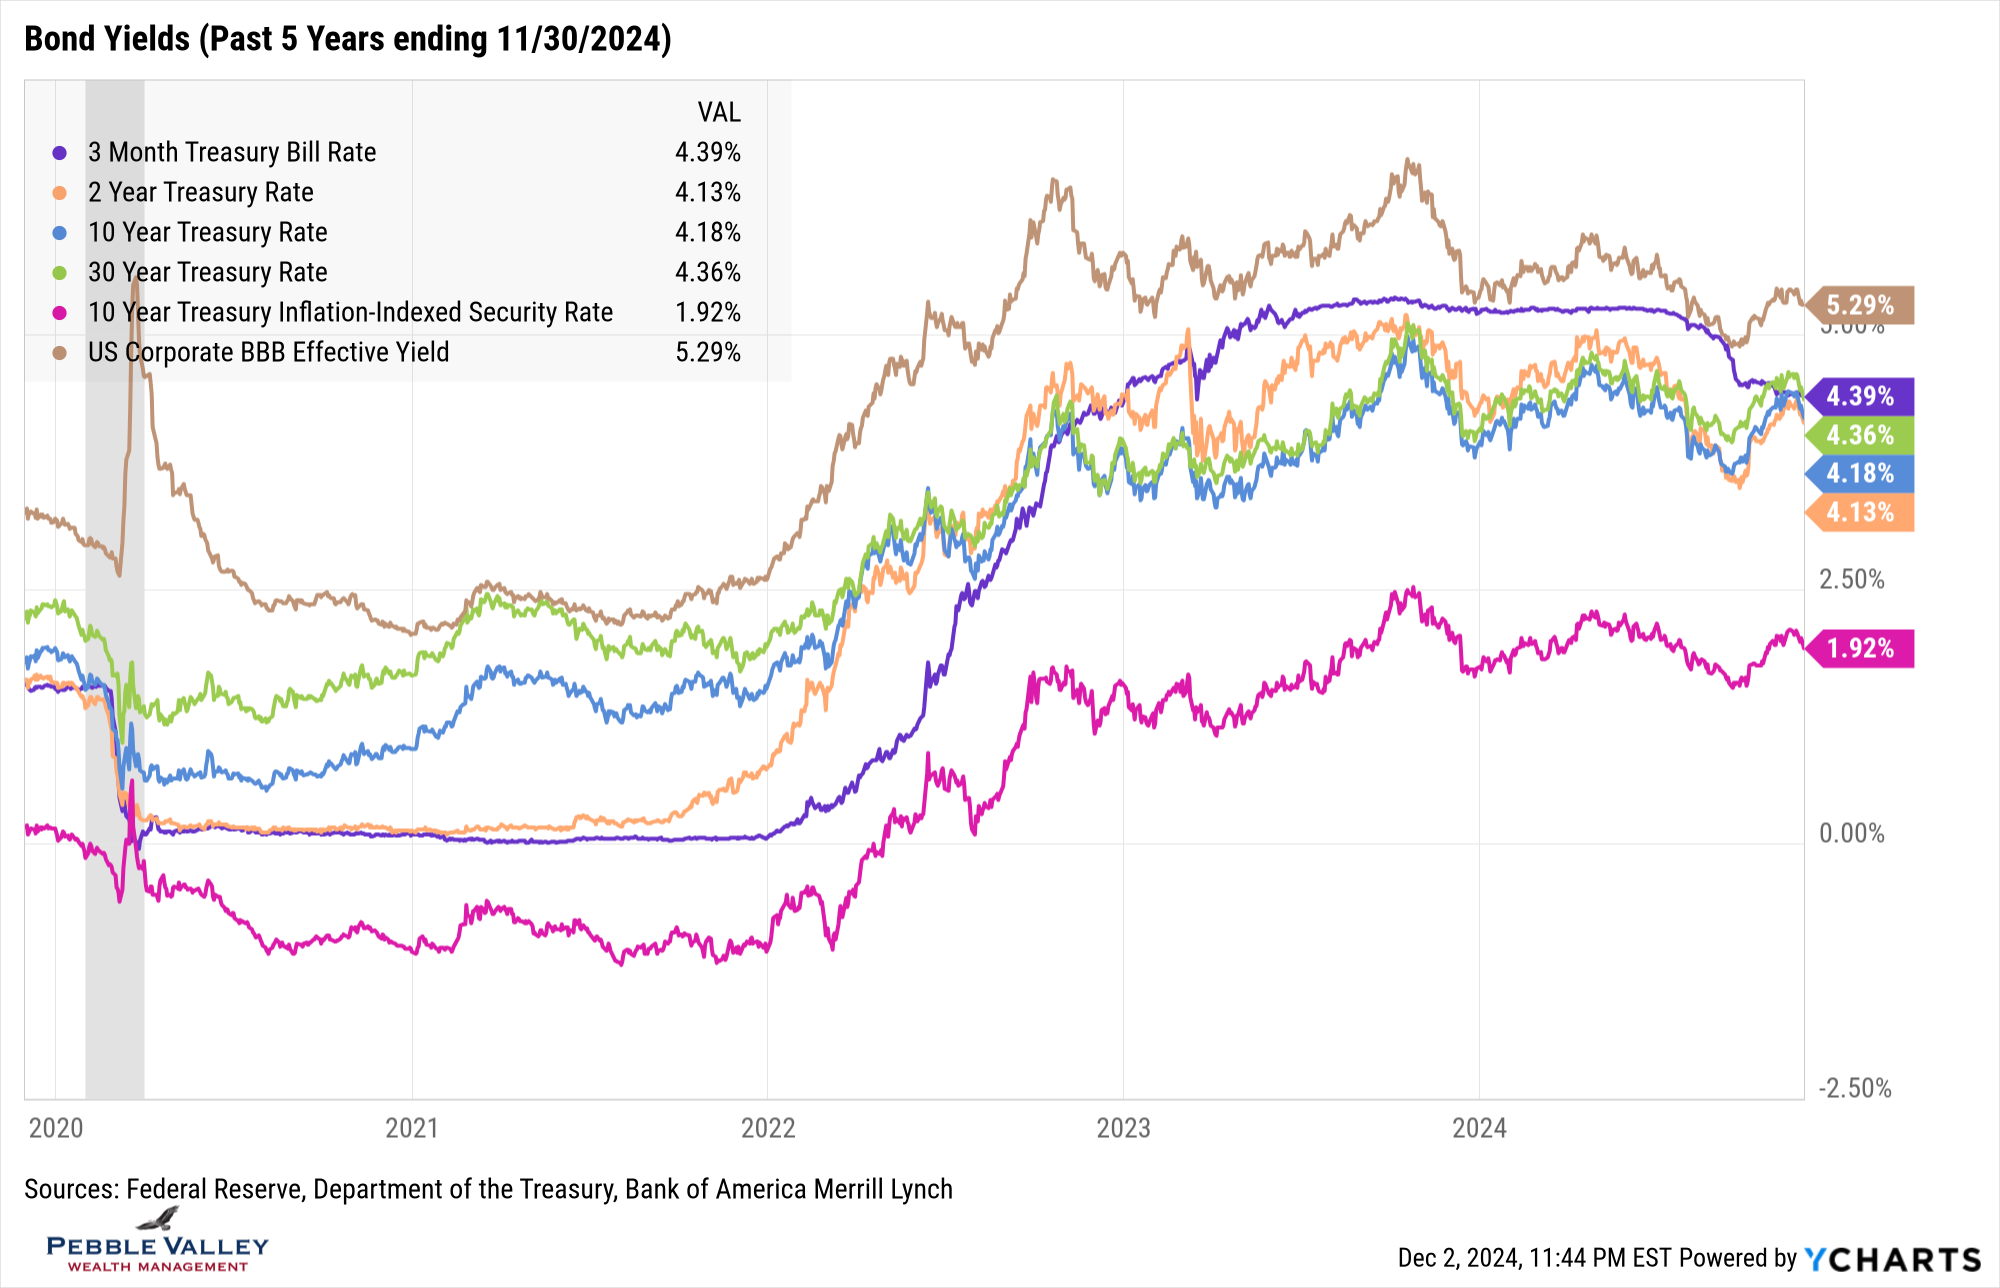
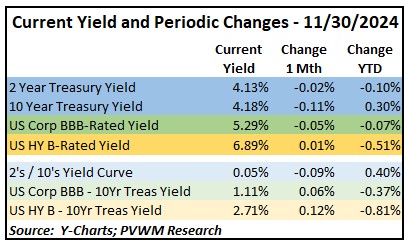
My usual Bond Yield graph looks like bond graphs should – kind of boring – and that’s a good thing! Rates did drift lower by about 10 basis points for the month but the large debt overhang of the US Government continues to loom (see special topic later). Putting on my “two-handed economist hat” – on one hand the concern of tariffs’ potential impact on inflation and extending tax cuts will continue to pressure rates higher; on the other hand, perhaps the tariffs won’t be as high and used more for negotiation, there will be more US growth with a pro-business government, and reduced spending on the margin with a more conservative Congress passing bills and the Department of Government Efficiency (DOGE) bringing a business mindset and focus to the large areas of bureaucracy. And one thing that is difficult to model but underappreciated in estimates is the change in human behavior when different costs and incentives are presented.
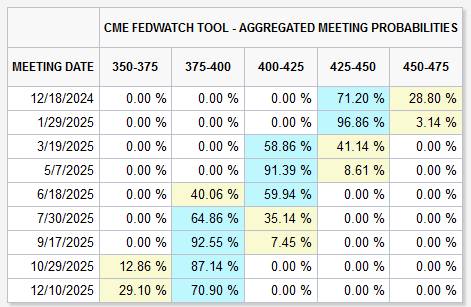
The next FOMC meeting concludes on Wednesday December 18. This meeting will include an update to the Summary of Economic Projections which is always interesting. The market is pricing in about a 70% chance of a 0.25% rate cut (currently 4.50-4.75%) according to the CME FedWatch Tool (as of 12/3/24). Looking ahead to the January 2025 meeting, the market is expecting the Fed to hold steady. The Fed’s preferred inflation measure – Core PCE – was up +0.3% for the month of October and +2.8% year-over-year, up from +2.7% at the last reading. It is unlikely the Fed will take action before knowing what new policies will be enacted, but with stickier inflation and added uncertainty, I am surprised by the market pricing of a rate cut. We will see a jobs report and CPI reading before the next meeting. Graph sourced from CME Fedwatch.
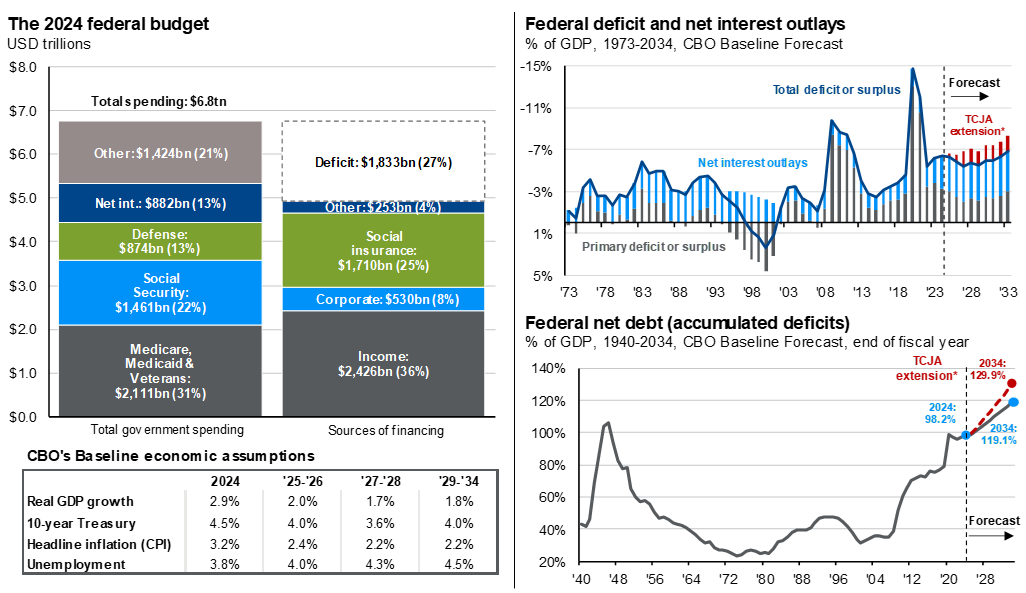
My special topic this month is debt and deficits. I will let the graphic below from JPM Guide to Markets do most of the talking. Here are a few comments and clarifications.
- Deficit is the annual difference between income and expenses. Most individual households need to balance their budget so the Deficit is $0. If there is a shortfall, debt must be taken (if offered!) and paid back over time.
- Debt is the accumulated annual deficits. If a shortfall only occurs in one year and paid off the next there would be no debt. If there is a continuous annual shortfall – the deficit – then not only is the debt not paid down but it keeps growing.
- There is a cost to this debt – called interest rates. A higher overall debt level requires more of the annual budget to be spent on servicing that debt. The US Government currently spends 13% of total spending to service the debt – more than on Defense.
- Yes, it is true that 53% of the annual spending is for Social Security, Medicare, Medicaid and Veterans. And there is no “lock box” for Social Security shortfall payments – it must come from current tax revenues – or more debt! Here is a recent blog post on SS and Medicare Funding Status.
- JPM models the deficit and debt impact in red if current tax rates set to expire in 2026 are extended. Two comments: 1) my belief of likely change in behavior which may generate more growth and therefore more tax income; 2) there will definitely be some cost which is why I believe most but not all the current tax rates will survive.
- Graph sourced from JPM Guide to the Markets – November 30, 2024
Yes, we can now jump in with both feet to the December festivities. Enjoy!
Have questions? Reach out! We're happy to help.
Posted by Kirk, a fee-only financial advisor who looks at your complete financial picture through the lens of a multi-disciplined, credentialed professional. www.pvwealthmgt.com


