Asset Class Returns - 10/31/2024
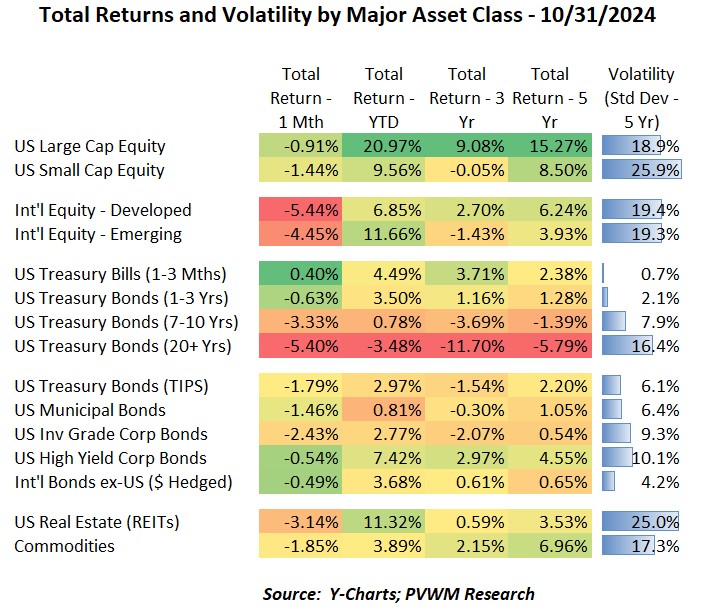
In the US equites market, the start of the month was positive with both Large and Small Caps hitting YTD highs. Even REITs recovered from a slow start and almost hit their YTD high despite rising rates. However, international equities were on a downtrend all month, though Emerging Markets were coming off a recent relative spike. Interest rates moved higher (bond prices down) pushing YTD returns for long-dated treasuries back into negative territory. Even 10-year treasuries had a -3.3% loss for the month, getting bond investors’ attention following the mid-September Fed rate cut. Looking at the table above, the only positive monthly return is short-dated Treasury Bills as duration did its damage on longer-dated bonds. US equities faired noticeably better than international though YTD those asset classes have very high returns with a longer-term view. The lower monthly returns for international equities is partially driven by higher rates – or more accurately fewer expected rate cuts – which strengthened the US dollar and impacts returns when converting back to US terms.
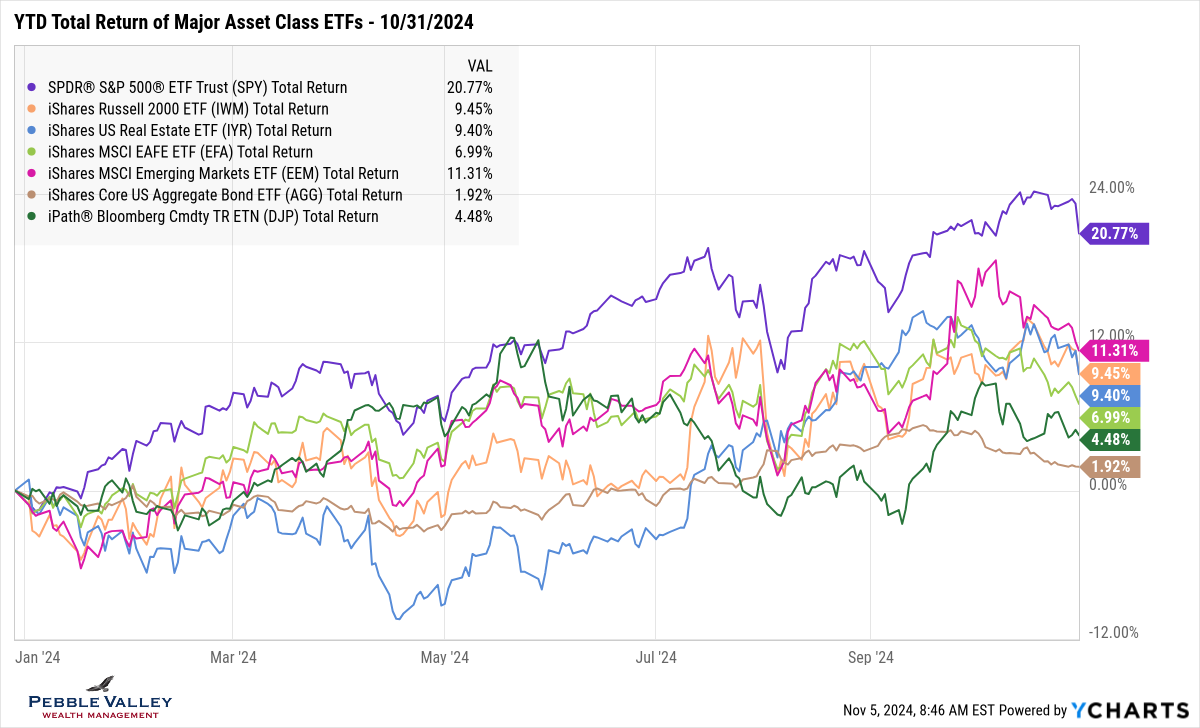
The graph below shows YTD total returns of major asset class ETFs. US Large Caps (captured by SPY, purple line) has owned the top throughout most of 2024. The sharp dip the last couple days was primarily driven by some tech companies announcing disappointing revenue outlooks during earnings calls. Sectors within US Large Caps that outperformed were Financials, Communication Services and Energy. As a reminder, Communications not only includes phone carriers but also tech heavy Meta and Google. Emerging Markets (ticker EEM – magenta line) had a strong run leading into October but couldn’t hold the momentum as expectations of stimulus out of China weren’t as great. However, all equities returns shown have YTD returns of 6.99% or higher, so let’s keep any pullbacks in context. The US Aggregate bond index (ticker AGG – brown line) continued to drift lower as rates rose substantially in October. Let’s go there now.
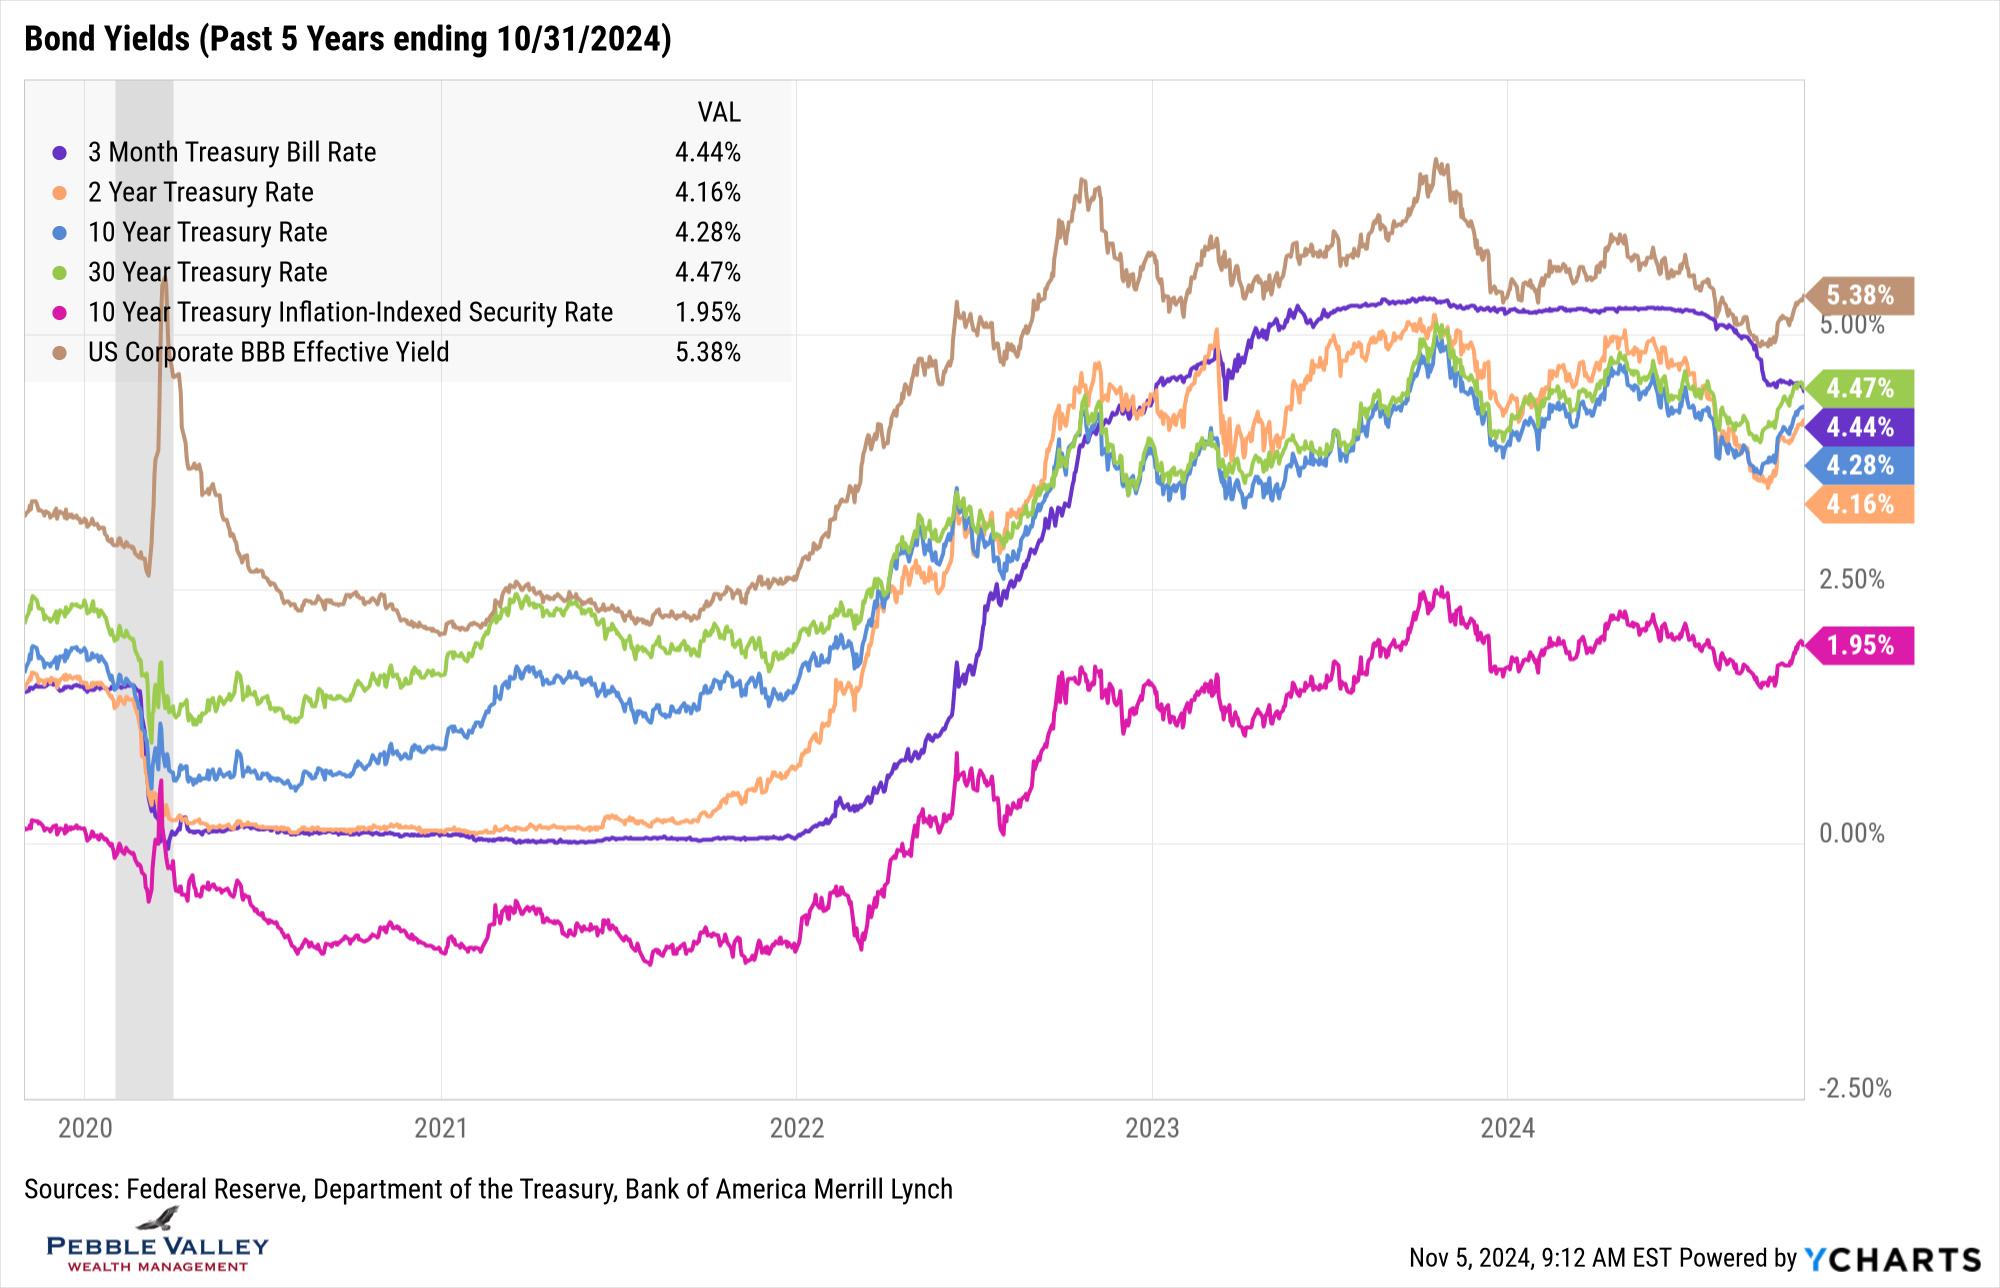
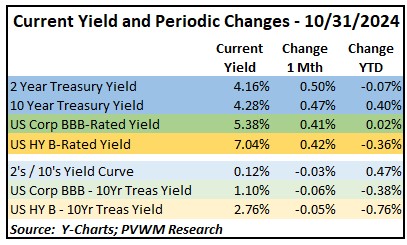
Last month I mentioned that rising longer-term rates continue to bear watching. There was plenty to watch in October. The 5-year graph below picks up the noticeable rise in rates over the past month with the exception of Treasury Bills which are tied to Fed activity (see later). Even real yields on Treasury Inflation Protected Securities (TIPS – magenta line) rose for the month, salvaging the fixed rate setting on I Bonds this cycle (see below). Looking at the table below the graph, you can see the rate change for the month was about 0.50% for Treasuries, with the 2s/10s curve even flattening by 3 basis points. Also note both BBB- (investment grade) and B-Rated (high yield) yields didn’t rise as much, leading to even tighter spreads this late in the credit cycle.
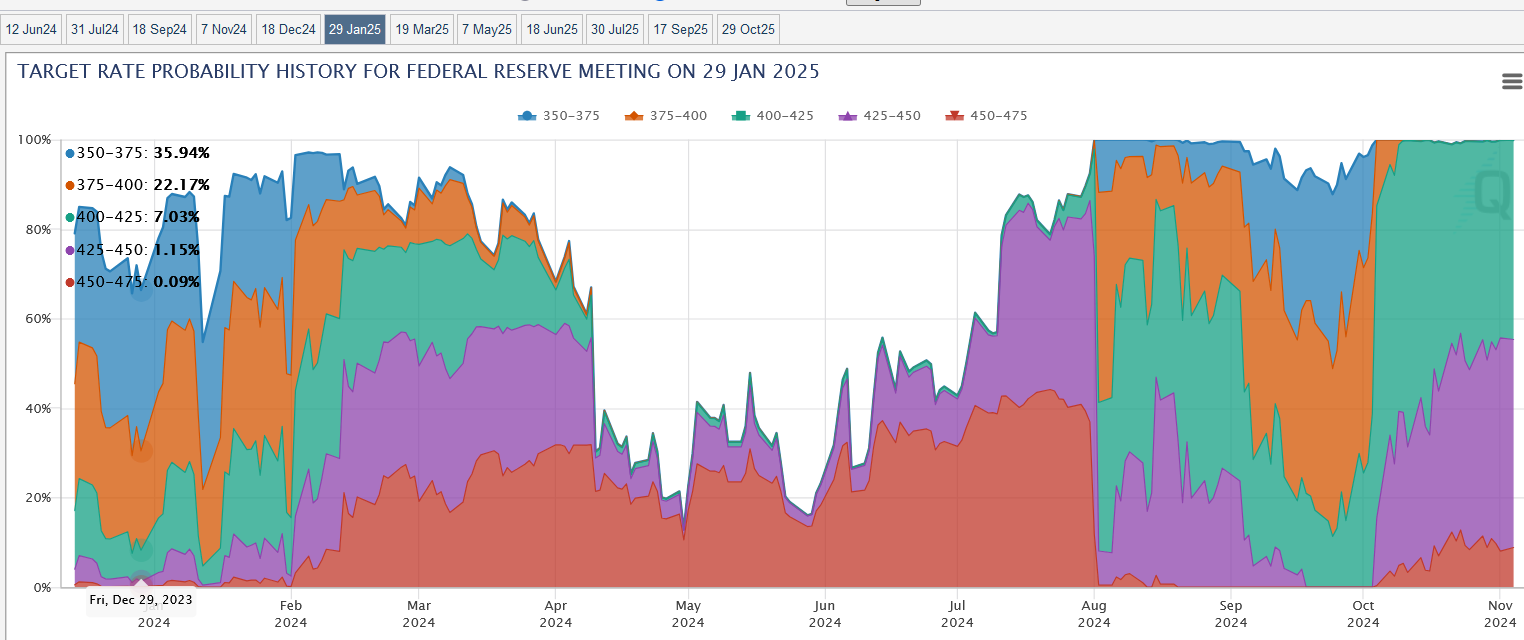
The next FOMC meeting concludes this Thursday November 7 (day later than normal due to not starting the two-day meeting on election day). The market is pricing in an overwhelmingly high probability the Fed will cut rates by 0.25%. More interesting to me is what is priced in over the next three meetings. Recall the current Fed Funds rate is 4.75 – 5.00% after the 0.50% cut in September. The graph below shows the implied probability of rate cuts after three more Fed meetings concluding on January 29, 2025. At the beginning of October, the market was pricing in at least four and possibly five 0.25% rate cuts. That is now backed off to likely three more cuts – one at each meeting. With recent economic data showing strong GDP growth, lingering inflation and a solid jobs market, even three cuts over three meetings could be too high. (graph sourced from CME Fedwatch).
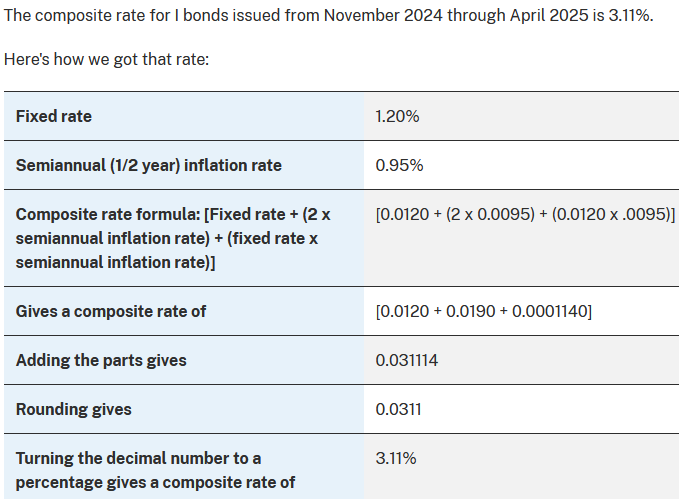
My special topic this month is I-Bonds. Recall the fixed-rate component of I-Bonds gets set by the Treasury each May 1 and November 1 and applies for the life of an I Bond, but only for funds deposited over the following six months of that reset. Recall TIPS real yield – magenta line – in the graph above that indicates the direction (not level) the rate reset may go. About a month ago I was expecting a noticeable drop from the last 1.30% fixed-rate component, but the rapid rise in rates during October resulted in a fixed rate component of 1.20%. Giddy-up! Some of you may pooh-pooh the headline crediting rate of 3.11% relative to current money markets or TBills, but I encourage you to focus on this relatively high fixed-rate component and lock that in. Money markets and TBills will float down as the Fed cuts rates.
I view I Bonds as a great “reserve fund” vehicles (provided access to other funds first 12 months) and not a trading vehicle. The fixed rate component is a very important feature to understand and there is a strategy to repurpose I Bonds for those who got all excited about the 9.62% rate back in 2022 but actually locked in a 0% fixed rate for life – until they repurpose. Here is a link to historic fixed-rates depending on when you deposited funds into an I Bond. You can see in that table someone who deposited funds since November of ’23 is earning 3.21% over the next six months while depositors between May ’20 through Oct ’22 are only earning 1.9%; both are using the same inflation component. Call us if looking for help.
Brief overview of I-Bonds
- Only available in electronic form on TreasuryDirect
- Maximum contribution PER YEAR is $10,000 per individual (SS#) or entity (Trust or business); the $10k is NOT a lifetime max, just annual contribution
- Crediting rate set every May 1 and November 1; contains both inflation component that applies to all I Bonds PLUS a fixed rate unique to each I-Bond receiving new deposits over the following six months
- Can’t access funds the first 12 months; if withdraw funds during following four years will lose last three months interest
- Interest is taxable at Fed but not state; can choose to recognize taxable interest each year or when sell; most choose the latter but for younger kids we recommend the former
It’s November. Let’s focus on the upcoming Thanksgiving celebration before jumping ahead to December festivities.
Have questions? Reach out! We're happy to help.
Posted by Kirk, a fee-only financial advisor who looks at your complete financial picture through the lens of a multi-disciplined, credentialed professional. www.pvwealthmgt.com


