

Asset Class Returns - 9/30/2024
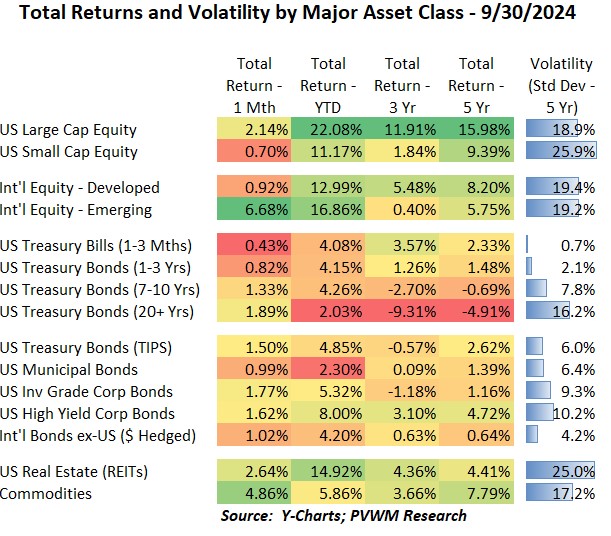
After a weak start to the month, risky asset classes started moving higher, especially after the Fed’s 0.50% rate cut on September 18 (more details later). The other catalyst in Emerging Markets was the China stimulus announced September 24th. This caused the Chinese markets to skyrocket about 20% after the announcement. Looking at the table above, you can see Emerging Markets was the top performer for the month and now exceeds International Developed markets on a YTD basis. US equity markets also had a solid month, bringing US Large Caps YTD return above 22%! REITs continue to join in on the rally, bringing their YTD return close to 15%, with a valuations boost from lower rates – for now. Commodities snapped back nicely and no longer are at bottom of the pack for YTD returns. Bonds keep doing their thing, though rising longer-term rates continue to bear watching.
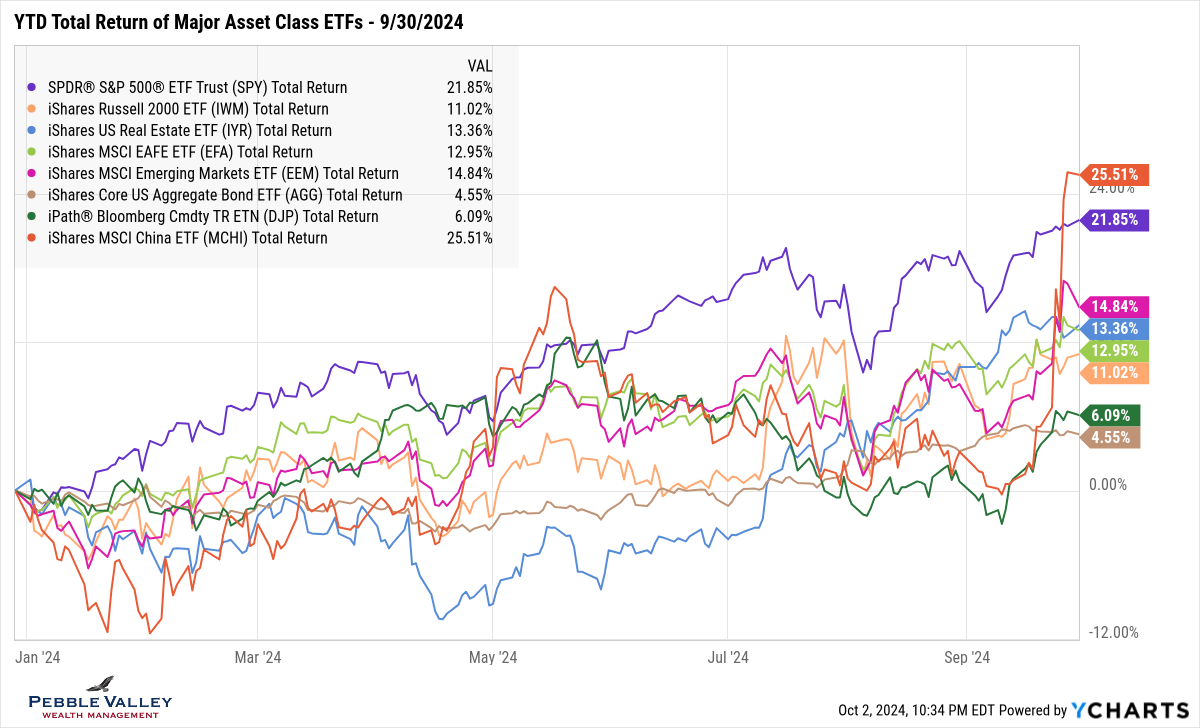
The graph below shows YTD total returns of major asset class ETFs. This month I added a Chinese ETF (ticker MCHI – orange line) to demonstrate the large pop in returns after the stimulus. The more diversified Emerging Markets ETF (ticker EEM – magenta line) has about 25% China weighting and captures a portion of the China returns. The other notable move is in Commodities (ticker DJP - green line). The US Corporate bond index (ticker AGG – brown line) is up nicely for nine months of work at 4.5% but now is the lowest returning asset class YTD on the graph.
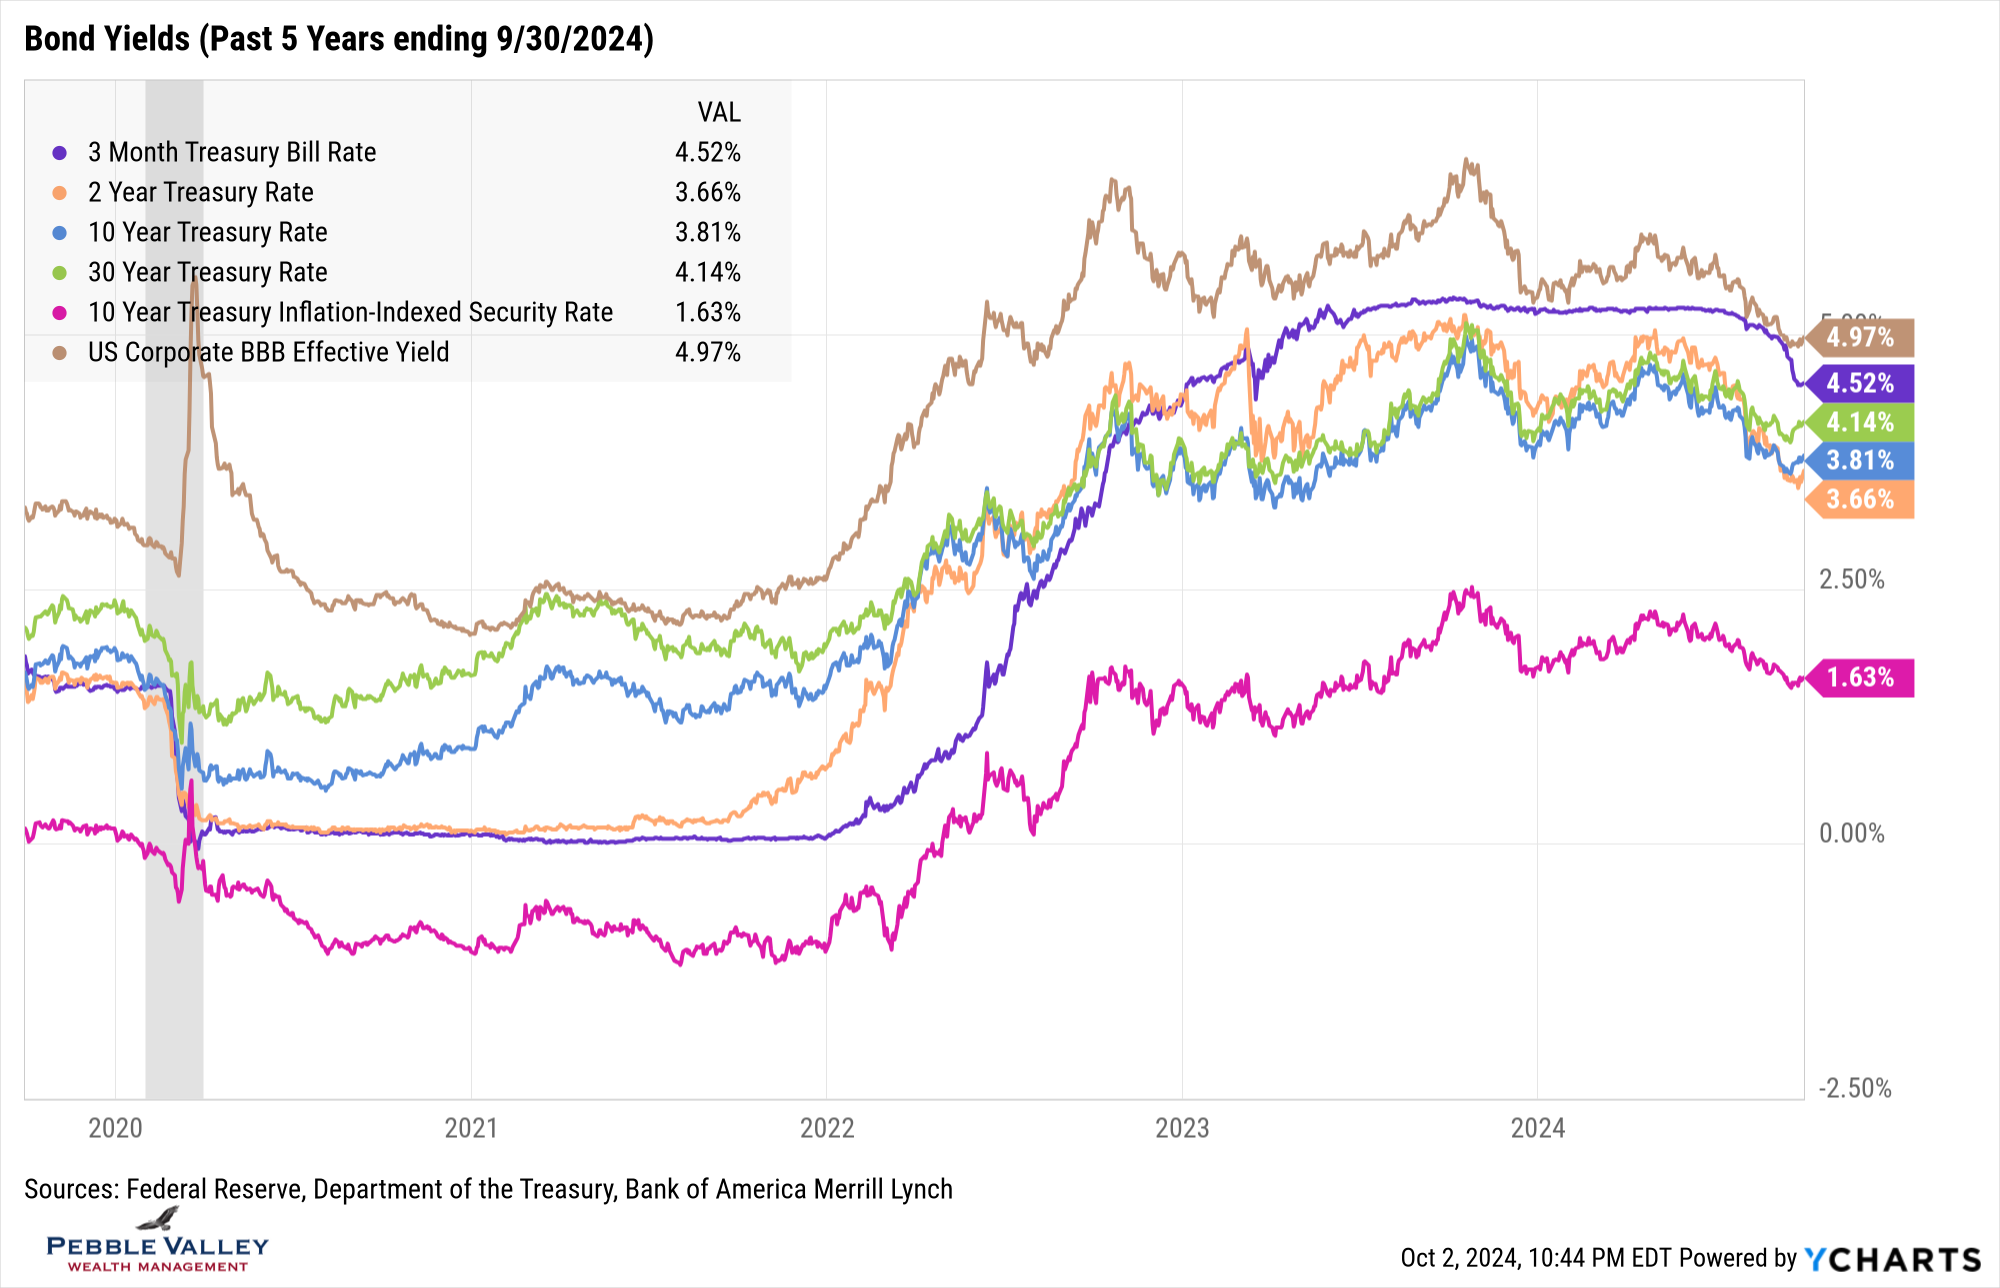
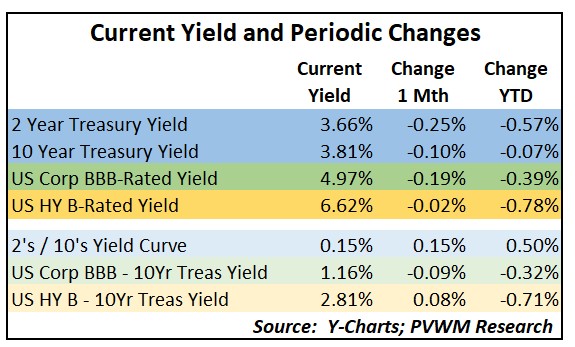
I am going back to my earlier bond graph that shows yields over the past 5 years without extra graphs at the bottom. Instead I added a new table which captures the current levels of 2s/10s curve and both BBB- (investment grade) and B-Rated (high yield) yields and related spreads over Treasuries. I then show how these yields and spreads have changed over the last month and YTD. A few things to note:
- 2-year treasury yield dropped substantially this month after the Fed’s 0.50% rate cut
- Longer-maturity yields started to move higher late in September as the yield curve normalizes and large Treasury debt load continues to weigh on the market
- The combination resulted in the curve (10yr – 2yr) steepening by a relatively large 0.15% for the month
- 3-month TBills will drop along with any Fed rates cuts; great news for floating-rate borrowers but still “ok” news for holders of cash – provided you put it to work.
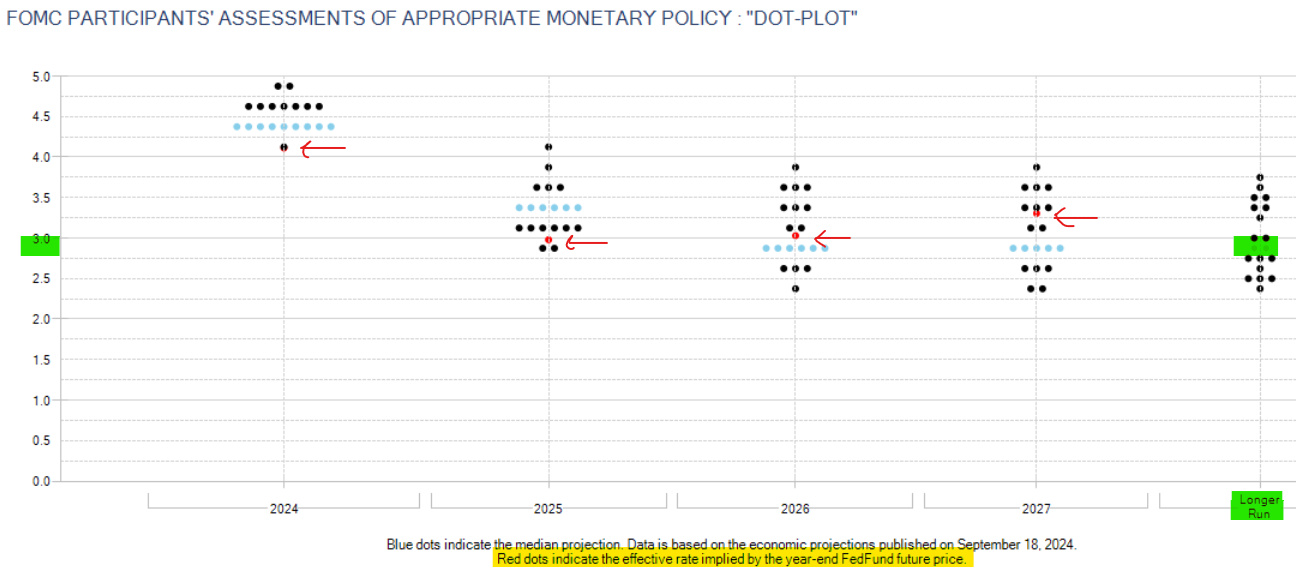
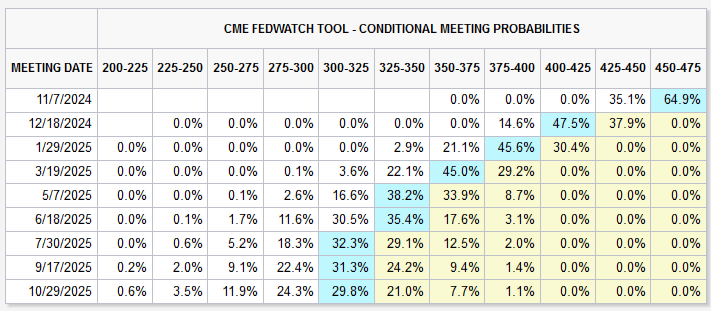
Before the FOMC meeting conclusion on September 18 the market was split whether the Fed would cut 0.25% or 0.50%. It went 0.50%. The risky asset classes liked it and jumped immediately. US Large Caps have trended down slightly while Small Caps moved decidedly lower. As mentioned above, the Fed controls short-term rates but market forces, while informed by Fed action, control longer term rates – including mortgage rates. The updated “Summary of Economic Projections” had improved ’24 and ‘25 estimates for inflation but unemployment projections were adjusted up slightly. The expected Fed Funds rate – i.e. the “dot plot” – is shown below. Relative to June the median rate is lower for the next couple years but worth noting the “Longer Run” estimate has crept up from 2.5% as recent as December 2023 up to 2.9% now. This reinforces not only higher for longer, but just higher. Note the red dots indicate where the market is pricing Fed Funds rates by each year-end. And speaking of market expectations, I also show the implied probability of different Fed Funds rates at future meetings (both graphs sourced from CME Fedwatch). Currently the markets lean toward a 0.25% cut at the November FOMC meeting, but a 0.50% cut at December meeting. But as Chair Powell said at a recent NABE meeting, it is data dependent. Once again, the next key catalyst to watch will be the Jobs Report this Friday.
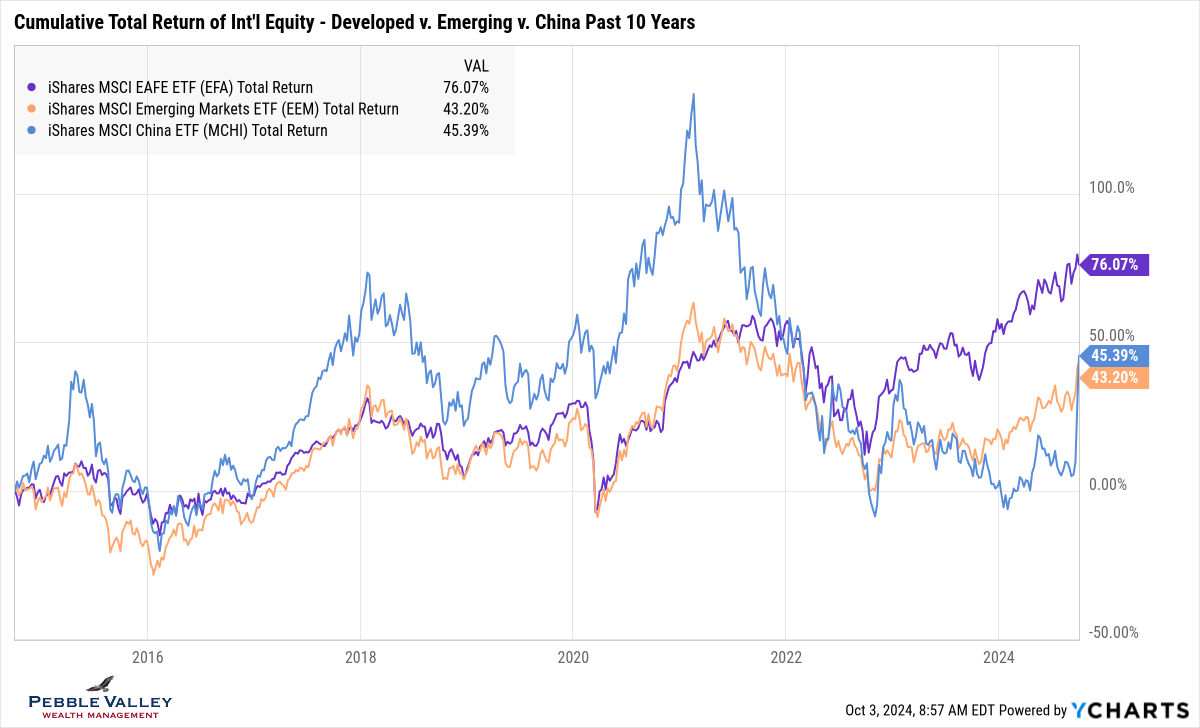
The special topic this month is putting the large 25% jump in China’s equities during September in context. The graph below shows the iShares China ETF (ticker MCHI) relative to the more diversified Emerging Markets and Developed Markets index over the past 10 years. A few things to note:
- The recent pop in China stocks moved the cumulative returns back to early ’22 levels
- The more diversified Emerging Market ETF (25% weight to China) captures that exposure with less volatility (though can lag at times)
- Important to have exposure to International Developed markets as well; also note the recent outperformance
- Market timing is difficult and important to maintain at least a high portion of long-term desired exposure.
Welcome to October – the best month of the year!
Have questions? Reach out! We're happy to help.
Posted by Kirk, a fee-only financial advisor who looks at your complete financial picture through the lens of a multi-disciplined, credentialed professional. www.pvwealthmgt.com