

Equities will keep returning 12% a year, right? … right?!
US equity markets have performed quite well recently – at least for Large Caps. The YTD total return for S&P 500 through June 30th was 15.29%! Over the past 10 years, the annualized total return was 12.86%. But can these returns continue and did all asset classes experience these strong returns?
I will answer these questions by covering the following topics in this blog post:
- Briefly describe the concept of a diversified portfolio;
- Look at returns from major asset classes over different time periods;
- Explain the key drivers of expected returns for equities and bonds; and
- Summarize expected long-term returns from a few asset management firms.
Major asset classes of a diversified portfolio
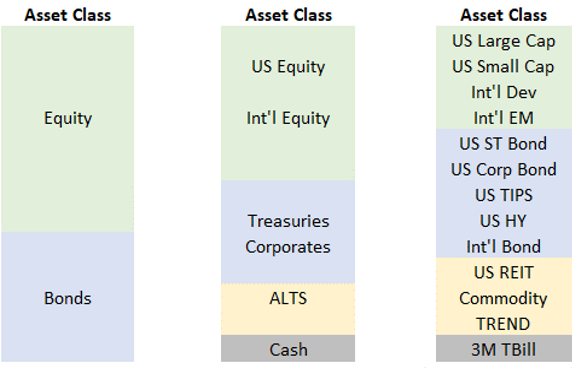
Before talking about returns across different asset classes, I will briefly explain the concept of a diversified portfolio. Prudent investing does not mean 100% of one’s portfolio should be in US Large Cap equities (like the S&P500) – especially those with a shorter time horizon or if not comfortable seeing the occasional 40+% drops in value. Investing in multiple asset classes with different price moves provides more stability while maintaining exposure to unknown returns of various markets. Correlation among asset classes is also considered. The traditional high-level allocation includes stocks, bonds and cash. A more refined approach splits these into further detail. The graphic below shows three different levels of refinement for asset classes in a portfolio. The % of each asset class in a given portfolio depends on the risk tolerance – and time horizon – of the investor.
Returns – and risk – vary across asset classes
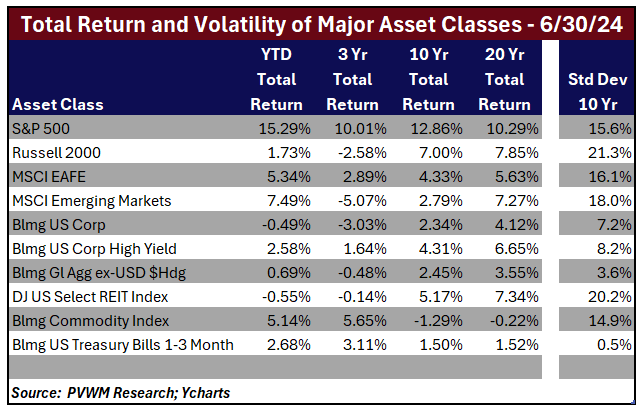
When summarizing asset classes, annualized returns are always shown. It is also important to know how volatile the prices are – commonly captured by standard deviation. The higher returning asset classes carry higher volatility and can experience larger falls from a previous relative high – called max drawdown. While longer-term returns are instructive, near-term returns can fluctuate, even within the same broad asset class. Notice the dispersion between US large (S&P 500) and small size (Russell 2000) companies as captured by the YTD and 3-Yr returns in the table below.
The recent strong outperformance of a single asset class and the noticeable lag in performance of a diversified portfolio (though better risk profile, but nobody cares in a bull market) was summarized recently in a podcast by Meb Faber called “The Bear Market in Diversification”. Here is an article discussing the concept.
Key drivers of expected future returns of equities and bonds
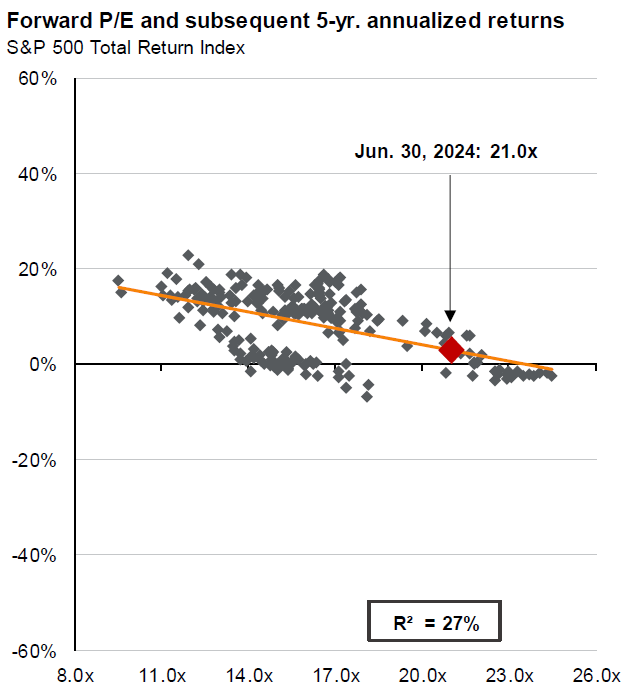
The key drivers to equity market valuation are expected earnings and the price investors pay for those earnings (how many multiples of earnings). Even if earnings remain flat or grow steadily, if the current price for those earnings is elevated, future returns may be lower if the multiple of earnings investors are willing to pay goes down. NOTE: THE EARNINGS MULTIPLE IS NOT A GOOD MARKET TIMING INDICATOR, BUT THE LEVEL WHEN STEPPING IN INFORMS FUTURE EXPECTATIONS. This concept is captured nicely by the following chart from JPMorgan Guide to Markets – June 30 2024.
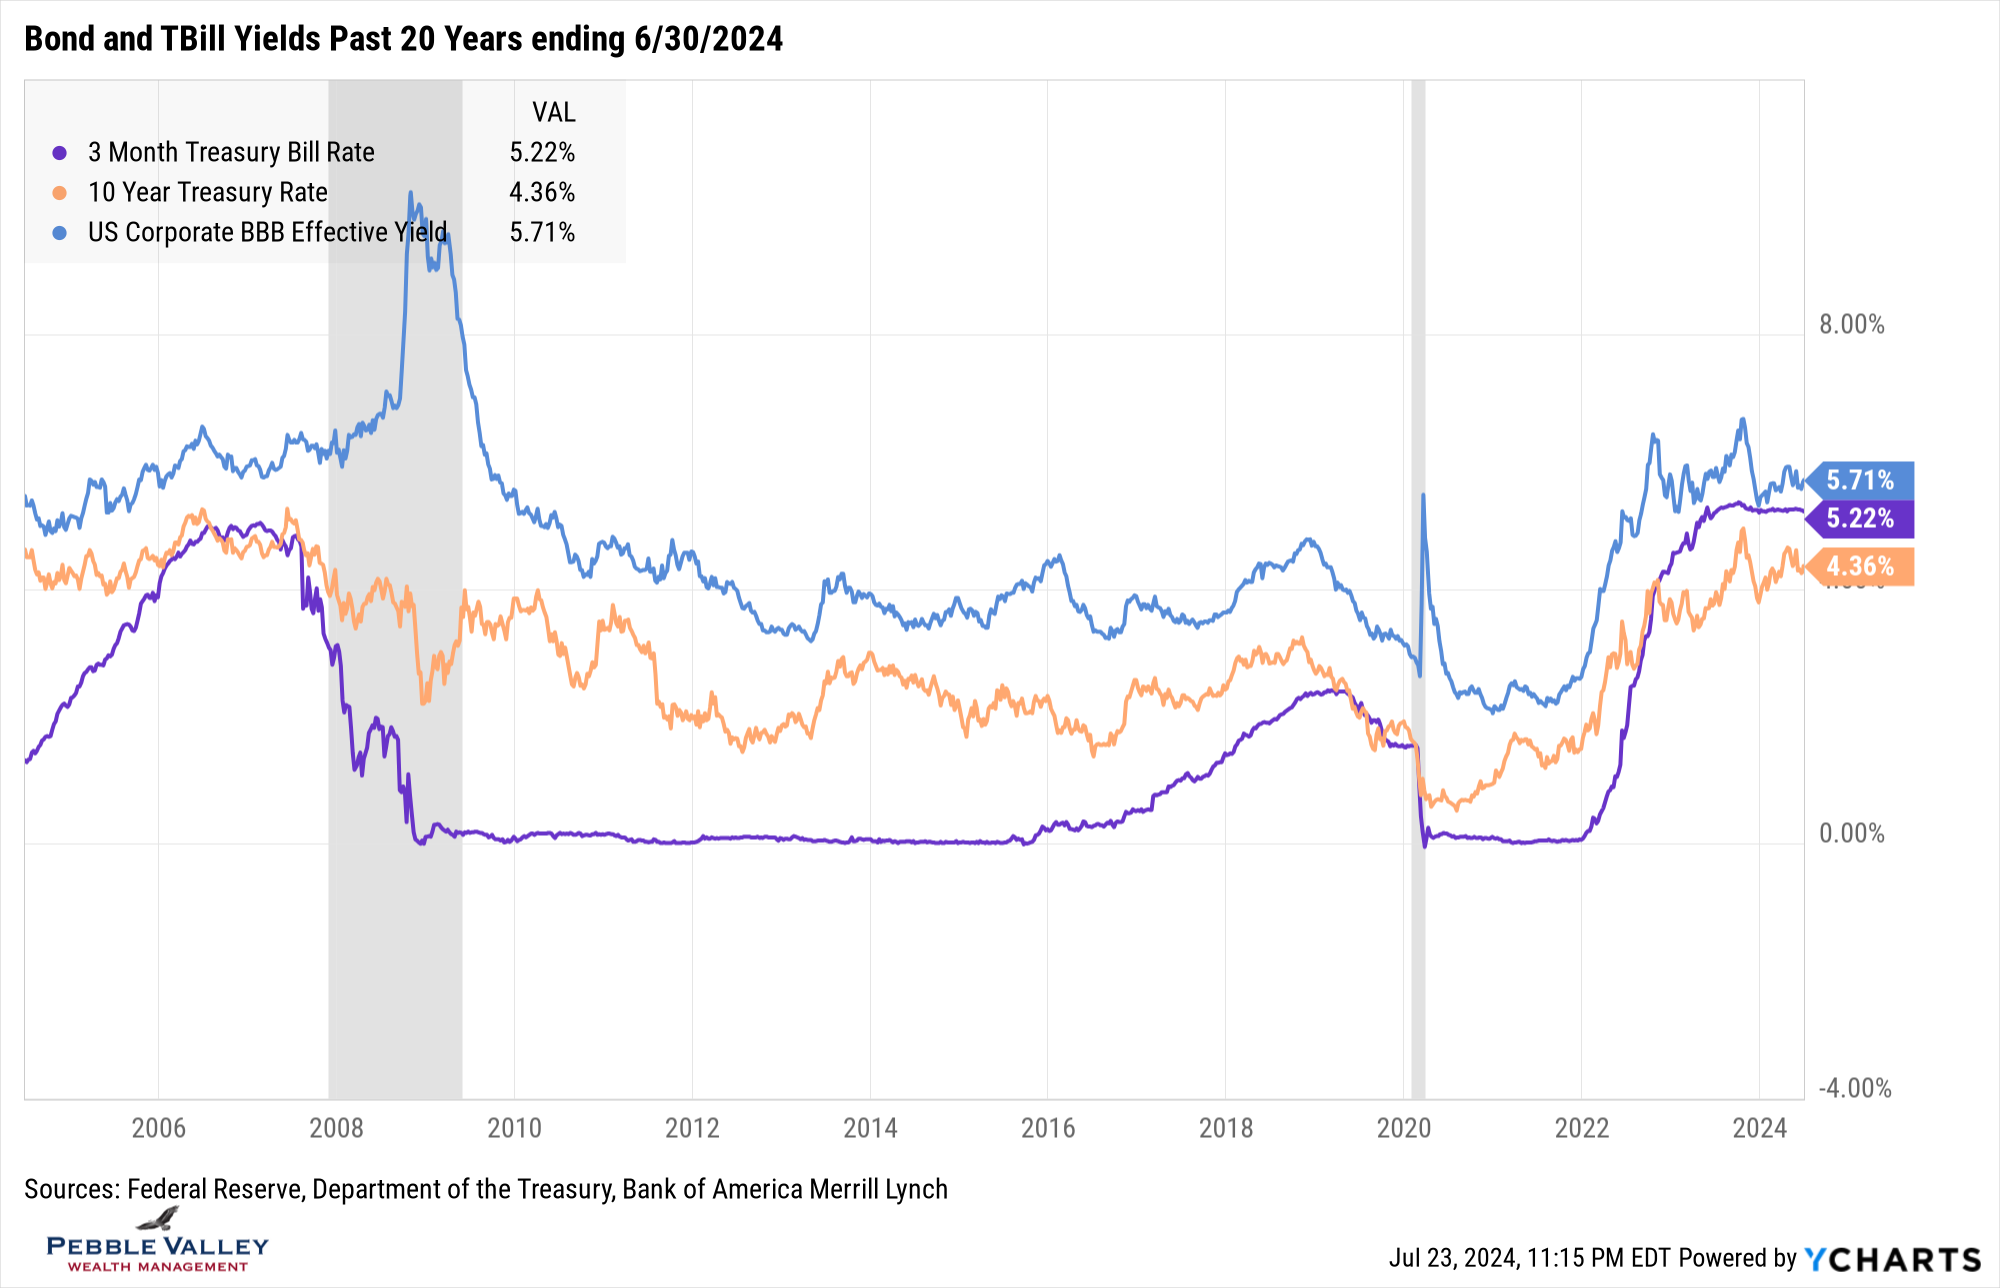
For bond asset classes, the key driver of expected total return is the current yield of a bond. Over the last 10 years after the financial crisis settled down, interest rates have been quite low, leading to lower returns. Lately yields have risen back to levels seen before the financial crisis, leading to higher current expected returns. The graph below shows that while current TBill levels are attractive, they are not likely to stay above longer-term bonds. It also shows that extra return (and extra risk) can be found in investment grade bond market vs. treasuries.
Expected long-term returns
Should you expect similar returns experience over the last 10-15 years to continue? Using the latest Capital Markets Assumptions from three major asset management firms provides some insights. Note these are long-term expectations, not near-term price forecasts.
For US equities – especially Large Caps - it is unlikely given the relatively higher valuations in the current environment. International equities may fare better, mostly driven by the relatively lower valuations – ie. lower multiples of earnings paid – but also by a potentially weaker US Dollar (you convert foreign earnings into US $ first to calculate returns; a weaker $ means you convert more). The other bright spot is the bond asset classes, helped by the relatively high – actually more normal – current rate environment. Even cash, after earning very little for so long, is expected to keep its head above water – i.e. returns higher than inflation.
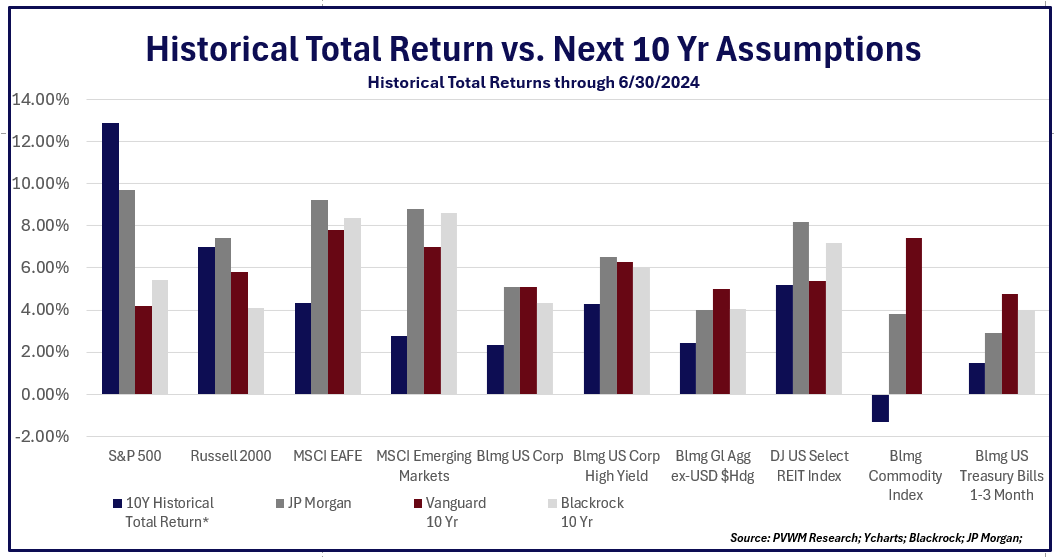
The graph summarizes the historical 10-year total returns by major asset class next to the long-term expected return from JPMorgan, Vanguard and Blackrock. You can see the noticeably lower expected returns relative to past 10 years for US equities (blue bars higher than others). All the other asset classes have the opposite effect – expected returns are projected to be higher than past 10-year. For international equities and commodities – substantially. Vanguard and Blackrock also published even longer 30 year expectations. The notable differences: about a 1.0 - 1.5% increase return expectations for US equities and emerging markets.
Remaining invested in a diversified portfolio is a prudent move and “Stocks for the Long Run” with the appropriate % is foundational to a well-constructed portfolio. But make sure the stocks in your portfolio contain some international equities, and return expectations are a bit tempered relative to the recent past. And unlike 2022 when bonds got clocked, current yield levels give them a much better fighting chance. Happy investing – and call for help if it isn’t so happy!
A quick shout out to our intern Tim Nelson for helping gather the outside firms' data and creating the graphs above. You can see the nice use of firm-themed colors adds a nice visual pop! ... and he's damn good at getting his arms around Python, as is my other intern, Maura Schneider.
Have questions? Reach out! We're happy to help.
Posted by Kirk, a fee-only financial advisor who looks at your complete financial picture through the lens of a multi-disciplined, credentialed professional. www.pvwealthmgt.com