

Asset Class Returns - 8/31/2024
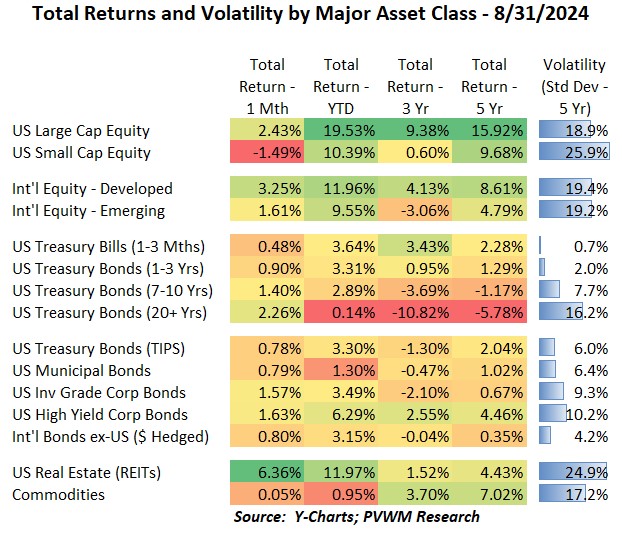
The first few days of August were choppy to say the least. After a weaker than expected jobs report on August 2nd (based on unemployment rate at least) and the combination of the US Federal Reserve leaning toward a rate cut in September while the Japanese Central Bank raised rates on July 31st, there was a significant pullback in risky asset classes leading up to and a few days following August 5. The volatility gauge (as measured by VIX) also popped substantially that day as various trades were unwound that relied on (or at least influenced by) borrowing funds in Japanese denominated currency (aka – the “Yen carry trade”). However, looking at the table above you would think it was a pretty tame month, with markets up slightly (save for US Small Caps) during a quiet month of August. If only…
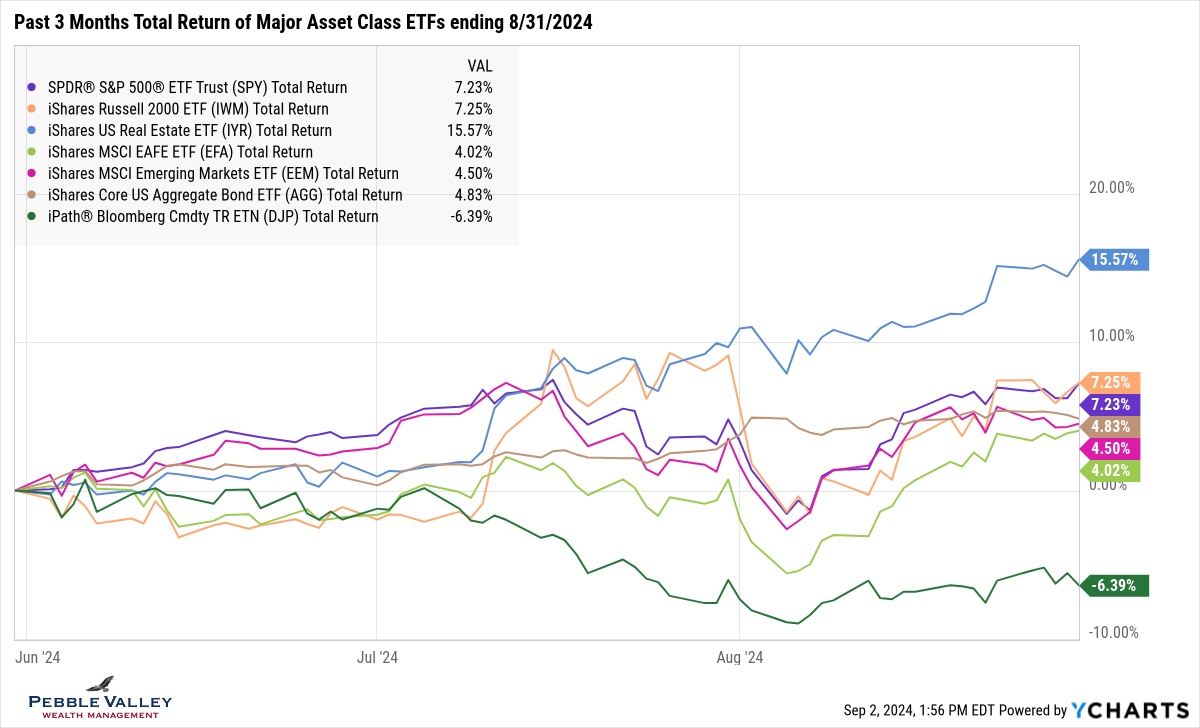
I will let you view the monthly and YTD returns in the table above – but do note how US REITs continue to power ahead. Instead, this month I will first show the major asset class returns over the past three months so you can see the price action and fast recovery around August 5th. Two asset classes that stand out are:
- US REITs, which didn’t fall much due to falling interest rates, and continued to rip higher
- Commodities, which started the month weak and continued throughout the month.
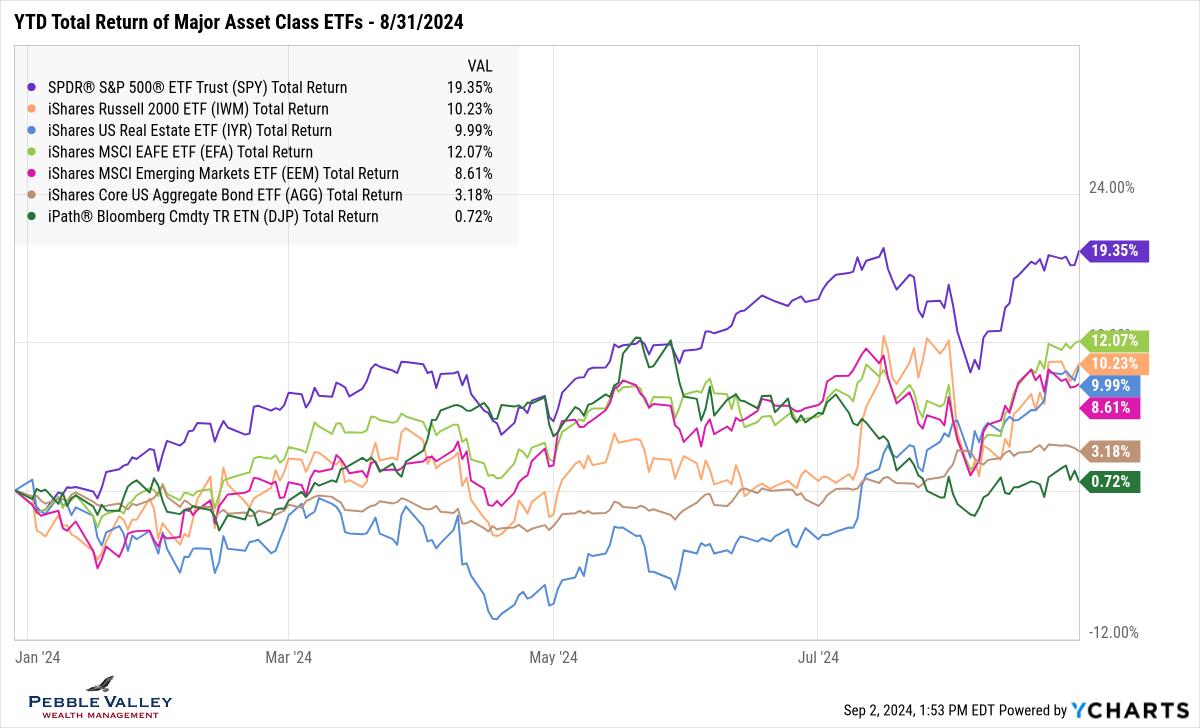
Expanding out to our usual YTD graph, note the other observations:
- US Large Caps – still dominated by tech but broadening out – ripped into month-end
- US Small Caps convergence toward Large Caps reversed in August but not as wide as end of June
- Int’l Developed equities are coming back to life in part on the weaker dollar
- US REITs is now up close to 10% YTD after being down 10% in mid-April
- Commodities are in a downward trend since the end of May and at bottom of pack
- Bonds keep doing their thing, now up 3.2% YTD, with a strong month of August
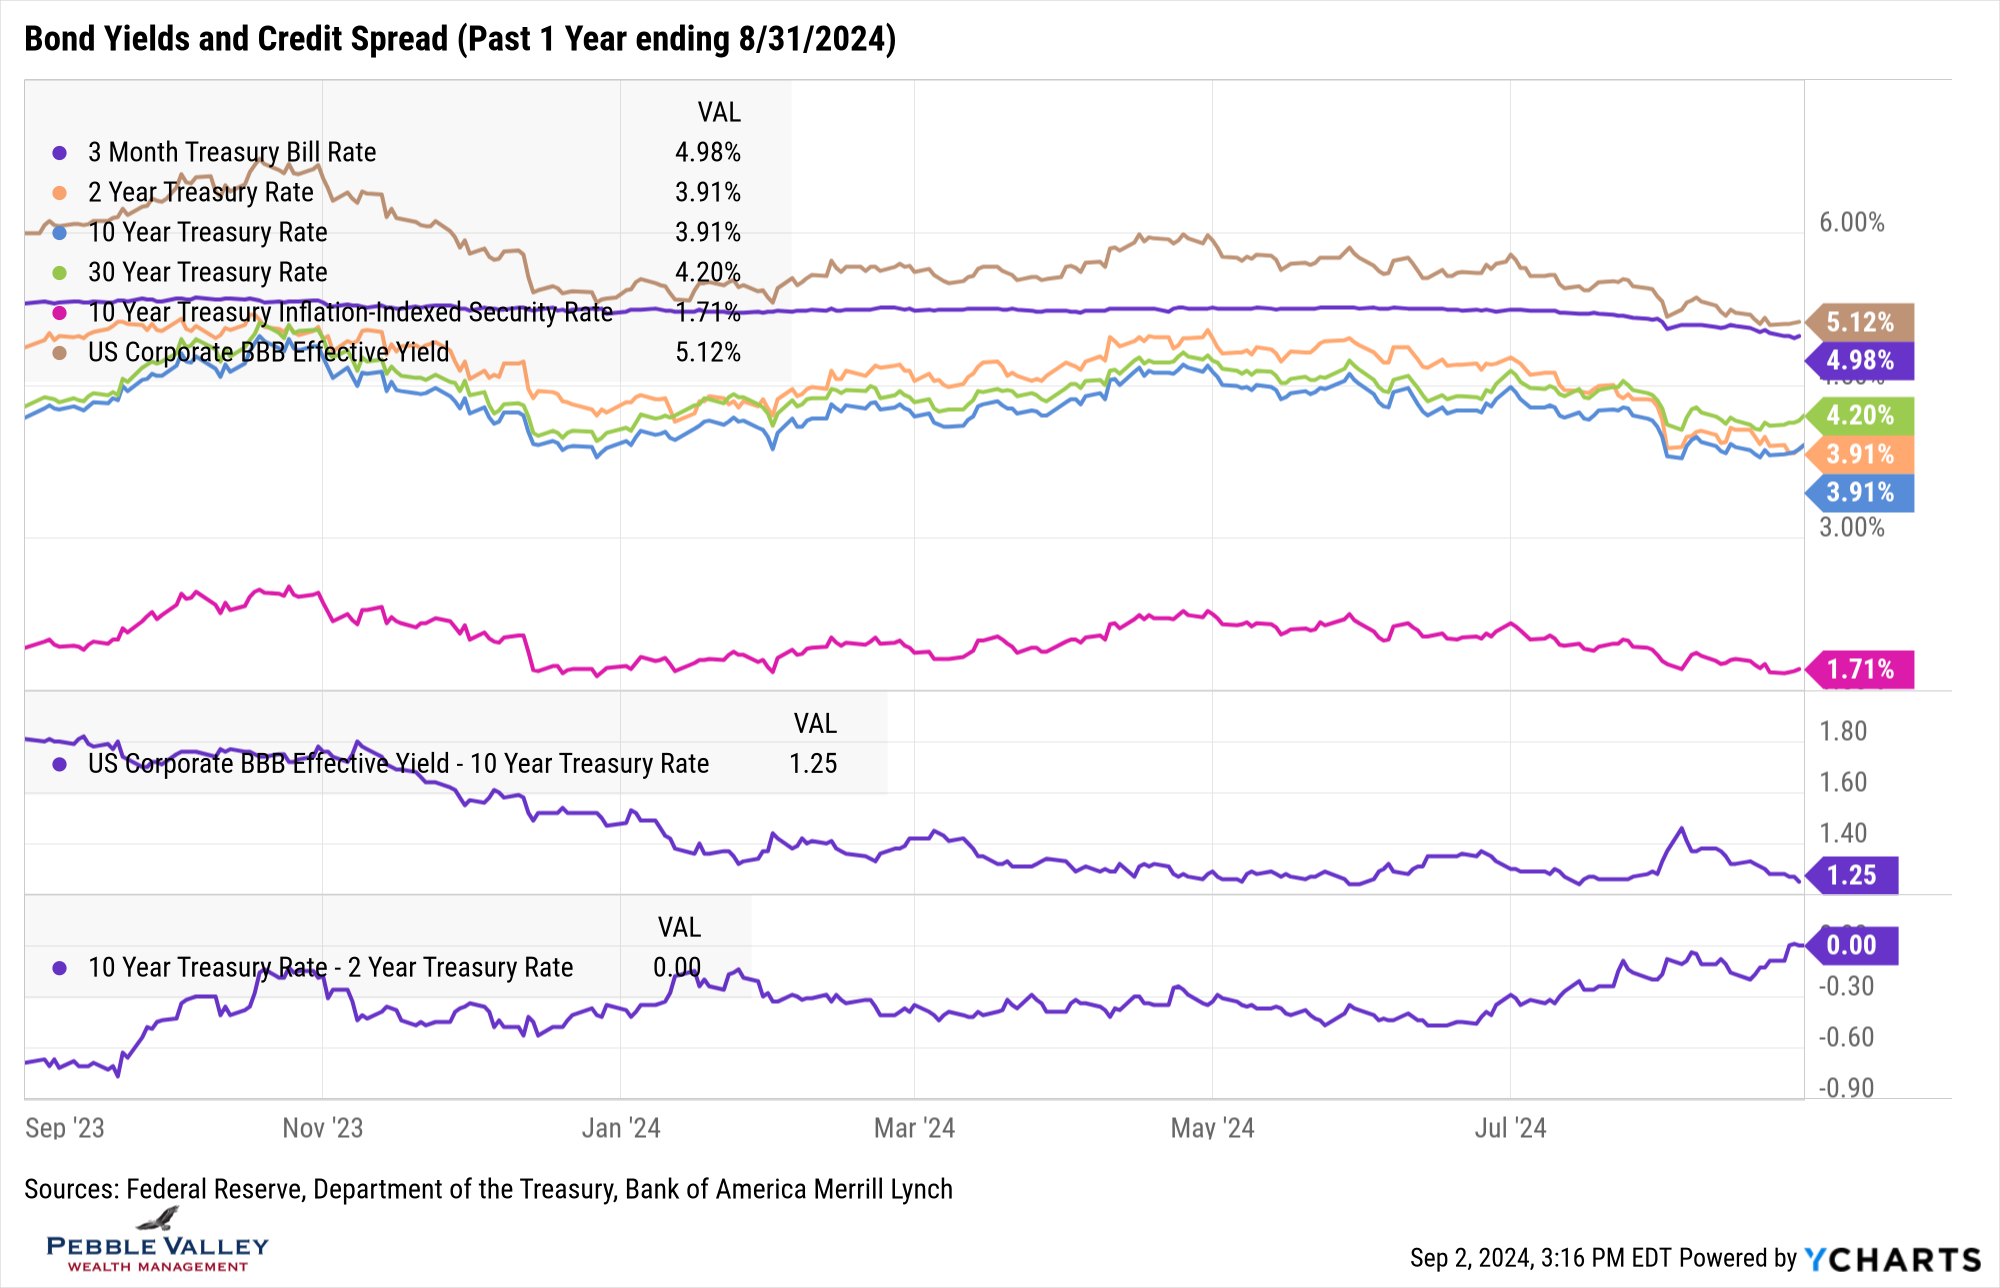
This month I am showing the bond yield graph over the past 12 months so you can see the related moves from early August in context with the “tight spreads” environment we are in. Credit spreads (BBB-rated) widened about 0.20% in early August while B-rated (mid high-yield bonds; not shown) widened about 0.35%, but both bounced back quickly. Using this shorter time period, you can also see the slight drift up in rates on the long-end (10- and 30-year maturities) as recent data shows a still relatively resilient economy The 2s/10s spread curve is now basically flat. Recall as the curve comes out of inversion, that can be an indicator of upcoming growth concerns as the Fed begins to cut rates.
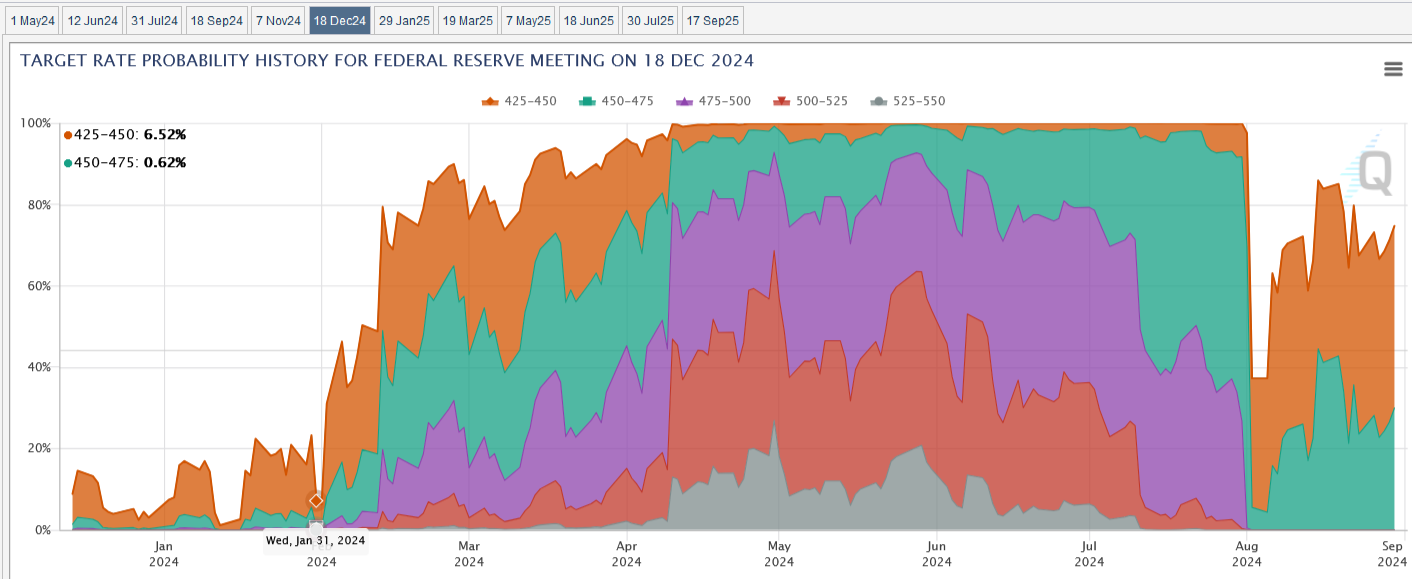
There was not an FOMC meeting during August but the Fed Governors gathered at the Jackson Hole Economic Symposium late in the month. Fed Chair Powell spoke on August 23 and stated “My confidence has grown that inflation is on a sustainable path back to 2%,…” all but assuring a rate cut at the next FOMC meeting that concludes September 18. “The direction of travel is clear, and the timing and pace of rate cuts will depend on incoming data, the evolving outlook, and the balance of risks,…” also assuring that the size and path is still uncertain. Note the Fed will also release their Summary of Economic Projections at this meeting. Let’s go to the CME Fedwatch Tool to see what the markets think will happen by the last meeting in December. First note the huge drop in expected rate cuts in early August in reaction to the “risk-off” discussed above. It didn’t take long to remove that overreaction in the Fed Funds market and now the most likely rate cuts priced in is 1.00%. With only three meetings left this year, that implies one meeting would have a 0.50% cut – again based on Fed Funds futures pricing. The next key catalyst to watch will be the Jobs Report this Friday.
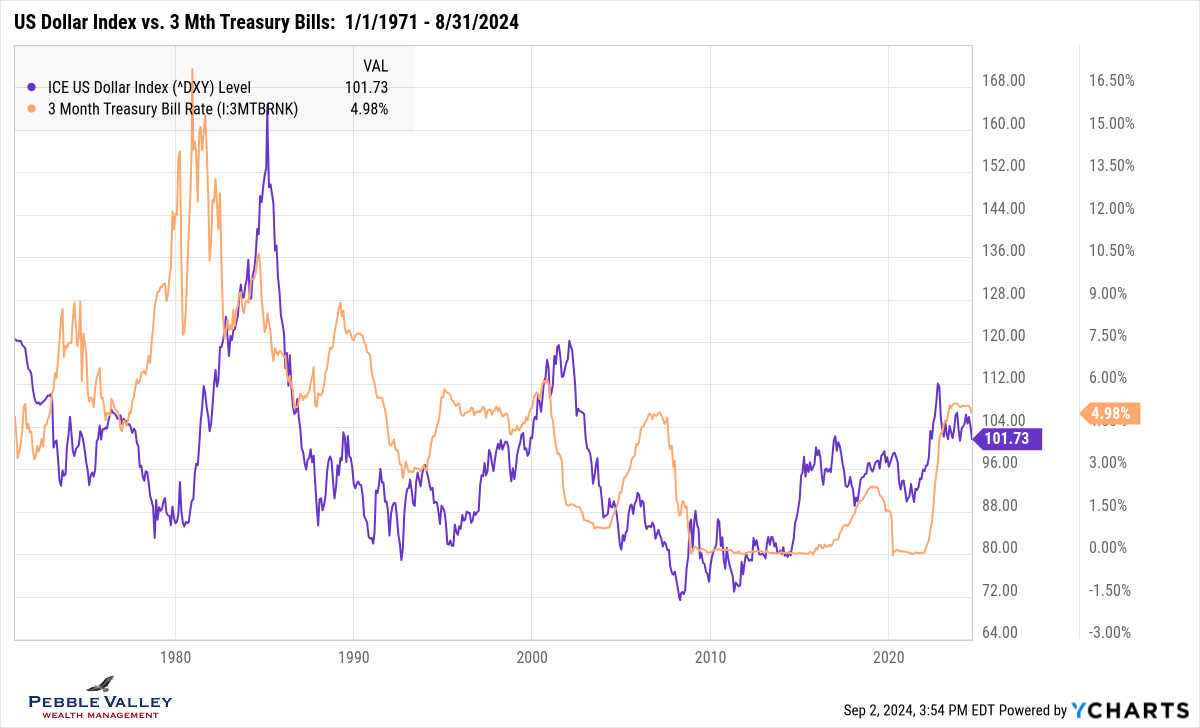
The special topic this month is the dollar index. The value of the US Dollar is driven by many factors and it is important to note the value of the US Dollar must be expressed relative to another currency. There was much attention paid specifically to the Japanese Yen to US Dollar early this month. One key driver of currency values is the relative short-term interest rate between the two currencies. If a given country has high short-term rates, all else being equal, an investor may want to be long that currency and short (i.e. borrow) a currency with low interest rates that is not expected to go up. The graph below shows the US Dollar Index back to 1971 along with 3-Month Treasury Bill yield. The index is made up of six foreign currencies – the Euro (EUR), Japanese yen (JPY), Canadian dollar (CAD), British pound (GBP), Swedish krona (SEK), and Swiss franc (CHF). As stated, there are many drivers to currency valuation, but two things to note:
- As the Fed starts to cut interest rates, our currency may begin to weaken if other Central Banks and related currencies aren’t cutting as much
- International investors saw relatively low performance in equity returns the past 15 years, partially impacted by the stronger dollar (took more international dollars to buy the US dollar, lowering US denominated returns); what will that impact be in the future?
September is here. Hang on to those summer days and embrace the clear blue skies of early fall. There, I said it!
Posted by Kirk, a fee-only financial advisor who looks at your complete financial picture through the lens of a multi-disciplined, credentialed professional. www.pvwealthmgt.com