Asset Class Returns - 7/31/2024
Welcome to this summer-shortened blog post. Enjoy your slower August!
NOTE: These comments are based on data through 7/31/2024 which includes the post-FOMC frenzy. There were noticeable losses in many risky asset classes today – 8/1.
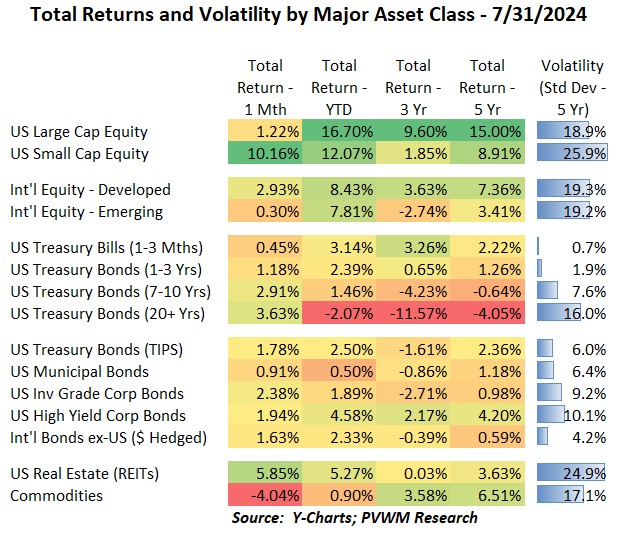
You can see the US Small Caps sticking out in the table above. After the tame June CPI reading released in early July this asset class made up some serious lost ground on the Large Caps. Surprisingly, the YTD performance still favors Large Caps, but the two are much more in balance. The most surprising item to me in the table is not the negative commodity return but the monthly return for REITs, which is reacting more to lower interest rates than the fundamentals of the commercial real estate. Longer duration bonds did well as rates fell about 0.40% on the long end while the 2-year rate fell even more, causing the curve to become less inverted – about 0.10% for the month - on the back of that tame CPI print resulting in the market pricing in more Fed moves (see later).
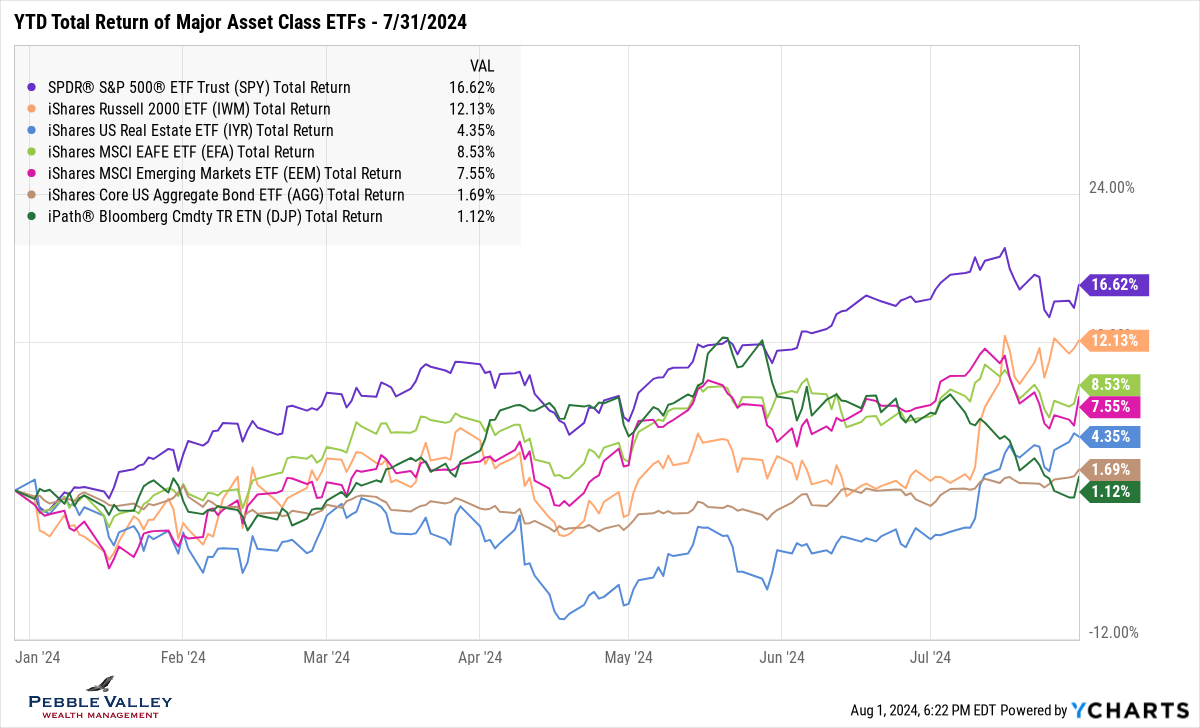
The graph below shows the unique action for July. The light orange line shows the US Small Cap rally. This is a good example of potentially missing out on the majority of an asset class annual return if out of that market for only a couple days. The light blue line captures the REIT surprise mentioned above. What else to note? How all the other major asset classes were flat to down for the month.
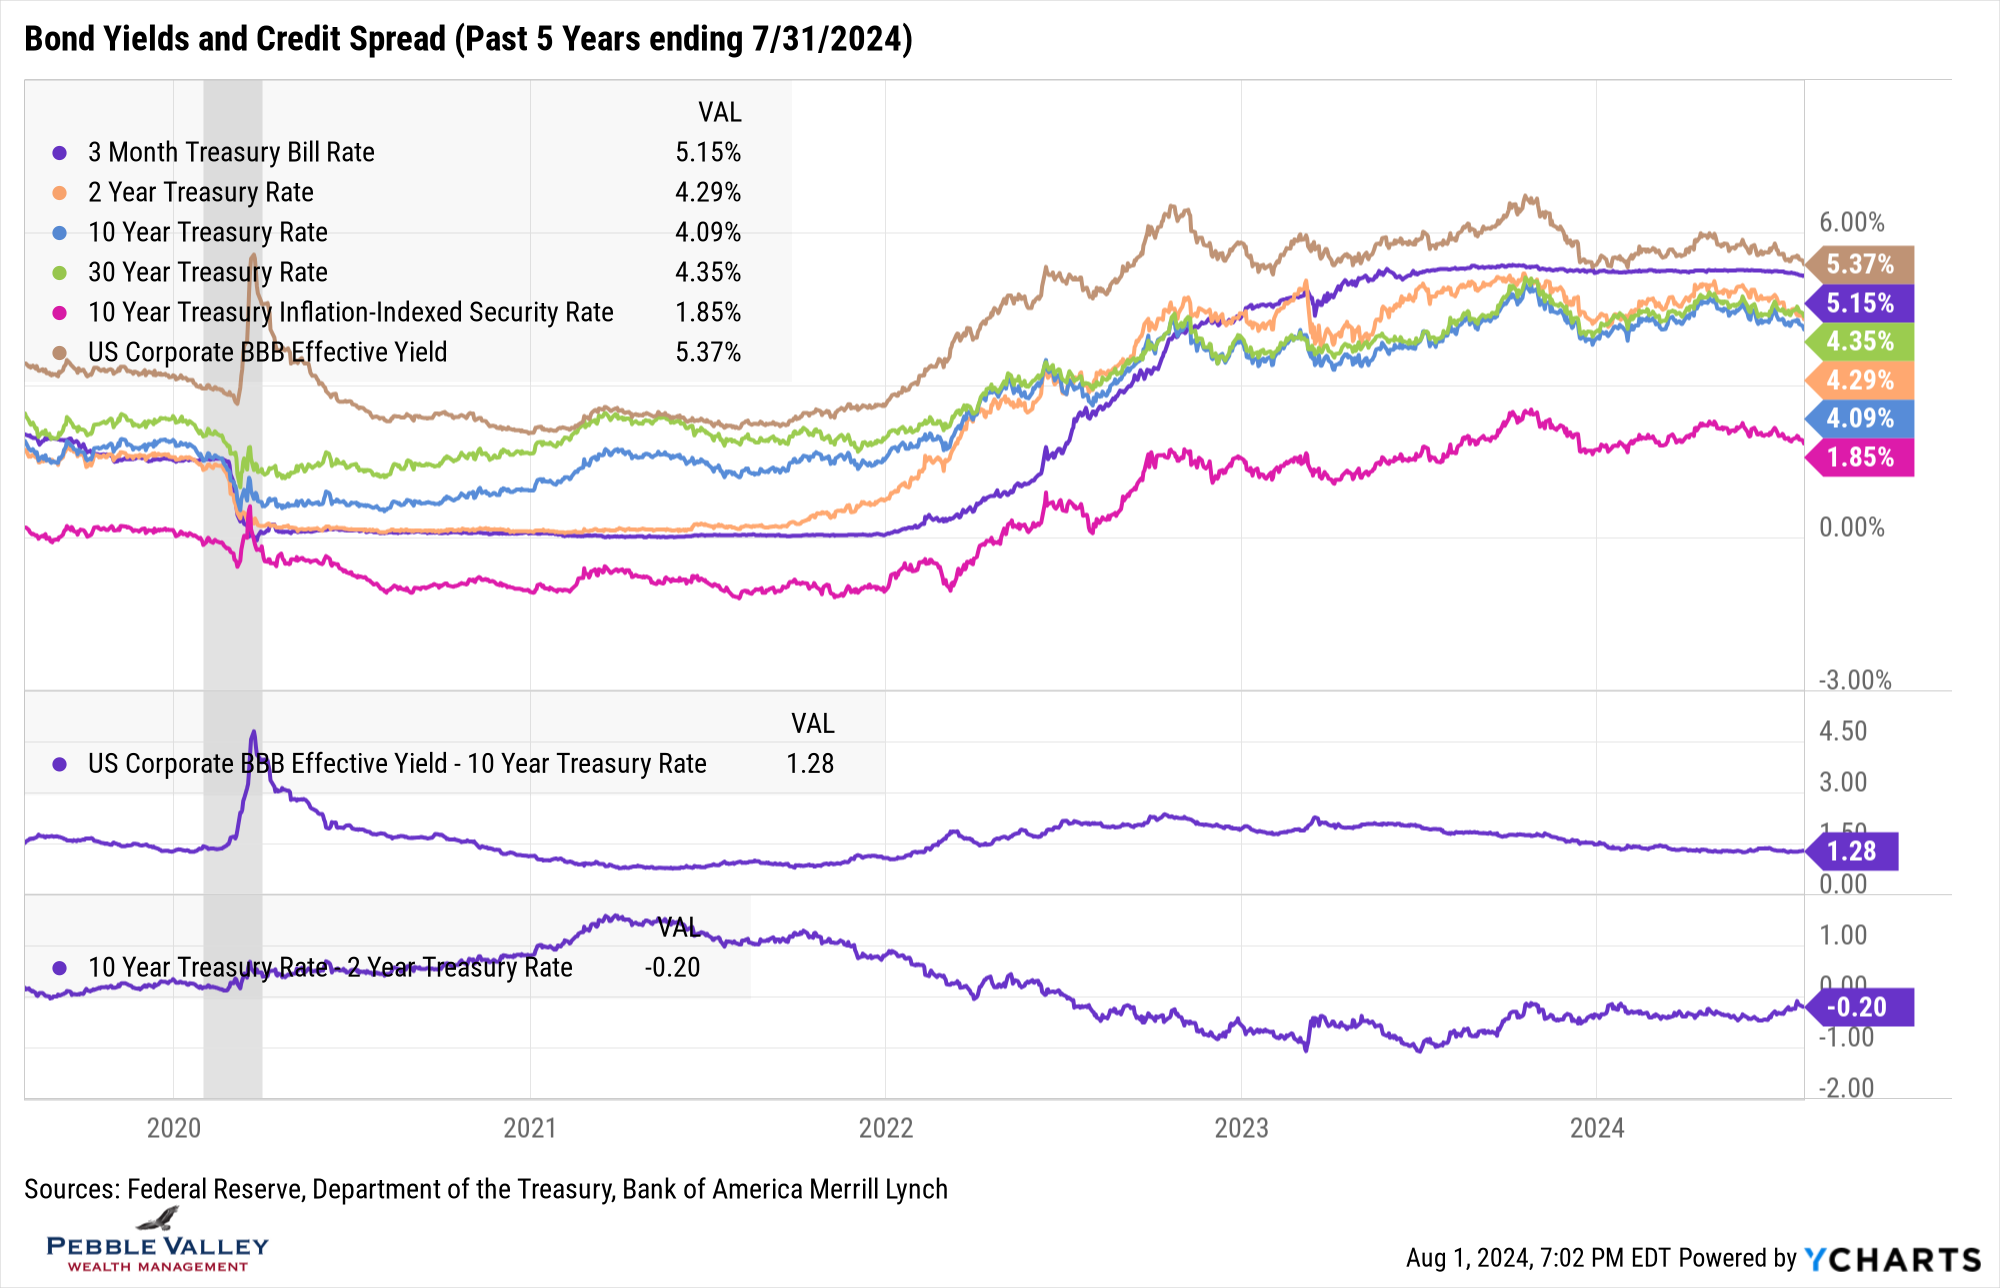
The bond yield graph captures the drift lower in rates for all bond types shown. Even 3-month T-Bills are starting to drift lower as potential Fed moves get priced in. The magenta line capturing 10-year real yield of TIPS is also moving down along with the nominal (regular) treasury yields. Credit spreads remain tight and will continue to do so, until they won’t – but don’t know when. I also added the 10s – 2s yield curve this month. This curve has been inverted for some time now, with many declaring a potential recession back in 2022 though it still has not arrived. However, as the curve comes out of inversion, that indicates the Fed rates cuts have started or very near. That point may be the better indicator of upcoming growth concerns.
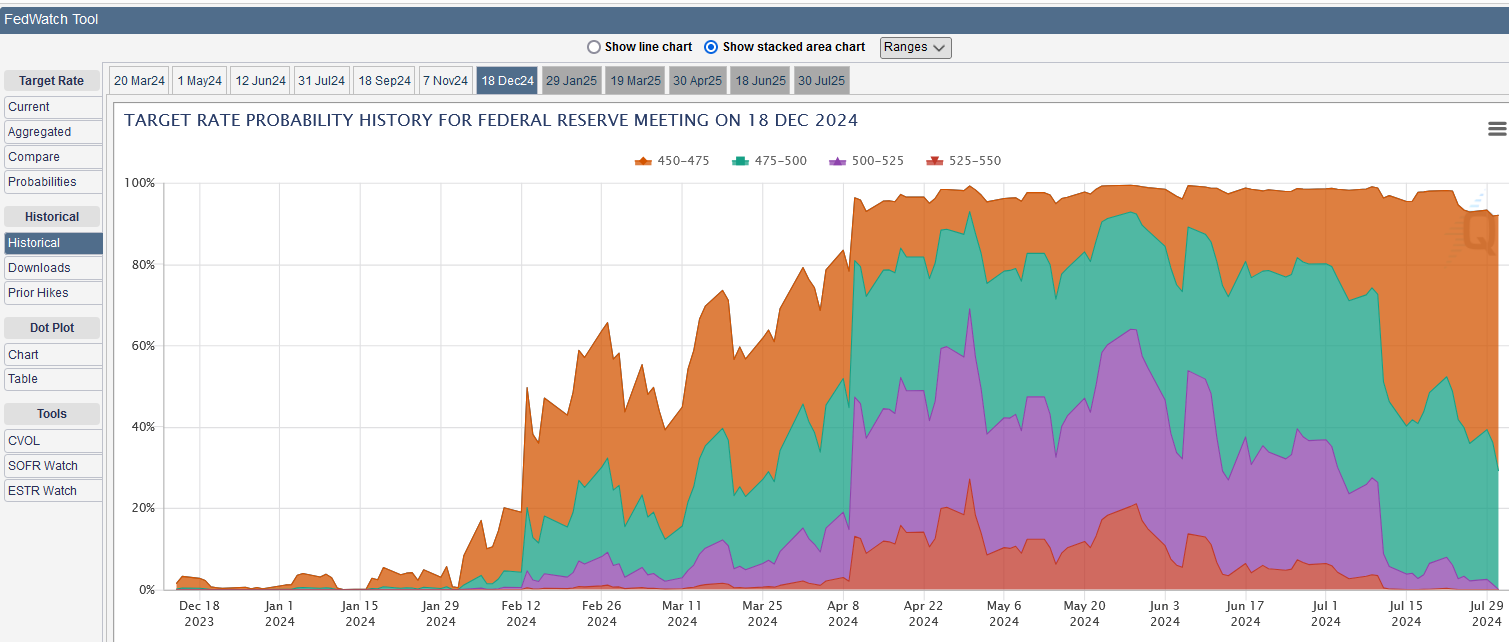
The latest FOMC meeting concluded July 31st. Rates were kept the same but the Fed statement included language discussing not just inflation that now only remains “somewhat elevated” but also referencing the slower jobs market, acknowledging “the unemployment rate has moved up but remains low.” The “somewhat” on inflation and “but remains low” on unemployment tells me while the Fed is moving toward the first rate cut, the data will need to reinforce over the next couple months to make it happen at the September FOMC meeting. What does the market think about rate cuts? As the kids would say, LFG! The CME Fedwatch Tool graph shows the market is currently pricing in an extremely high chance of three rate cuts by year-end. Note this can change as data changes. Recall the big change in sentiment last spring as the market began pricing out the 6-7 rate cuts that were priced in late last year.
My special topic this month is summer! Go get some! Optimistic me says we have two more months of summer in Chicago.
Posted by Kirk, a fee-only financial advisor who looks at your complete financial picture through the lens of a multi-disciplined, credentialed professional. www.pvwealthmgt.com


