

Asset Class Returns - 4/30/2024
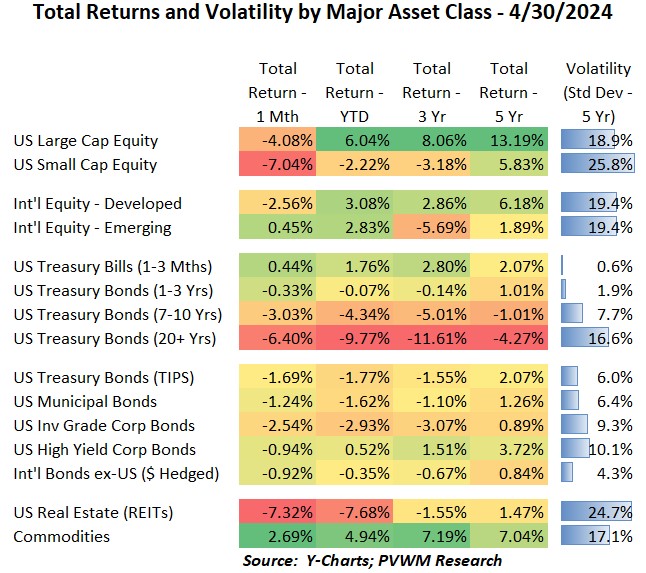
NOTE: For regular readers, the table above looks very similar to past blog posts but there are a few changes due to using Y-Charts as our new data source:
- Showing 3- and 5-year rather than calendar year 2023 and 10-year total returns
- Volatility calculation based on past 5 years of data, not 10
- Show different treasury maturities and dropped the inflation data
- Mostly same asset classes shown but different benchmarks used for the asset class
April was a down month for almost all asset classes. Similar to 2022, not only were equity markets down but also bonds – the longer the maturity the more painful. US Large caps continue to hang on to a +6.0% YTD return after this month’s 4% pullback. The same can’t be said of US Small caps; -7.0% downdraft in April brought YTD returns to -2.2%. International equities held up better, with Developed markets “only” down -2.5% while Emerging markets was positive for the month by +0.5%! Interest rates rose about 0.50% this month, leading to losses across all bond asset classes except T-Bills. Even high yield with tightening credit spreads couldn’t escape a loss this month. Jumping to the bottom of the table, you’ll see the biggest drop for the month belongs to REITs, down -7.3% for the month and a similar amount YTD. Commodities were the top performer of the month and a close second YTD, fueled recently by Gold and Cocoa.
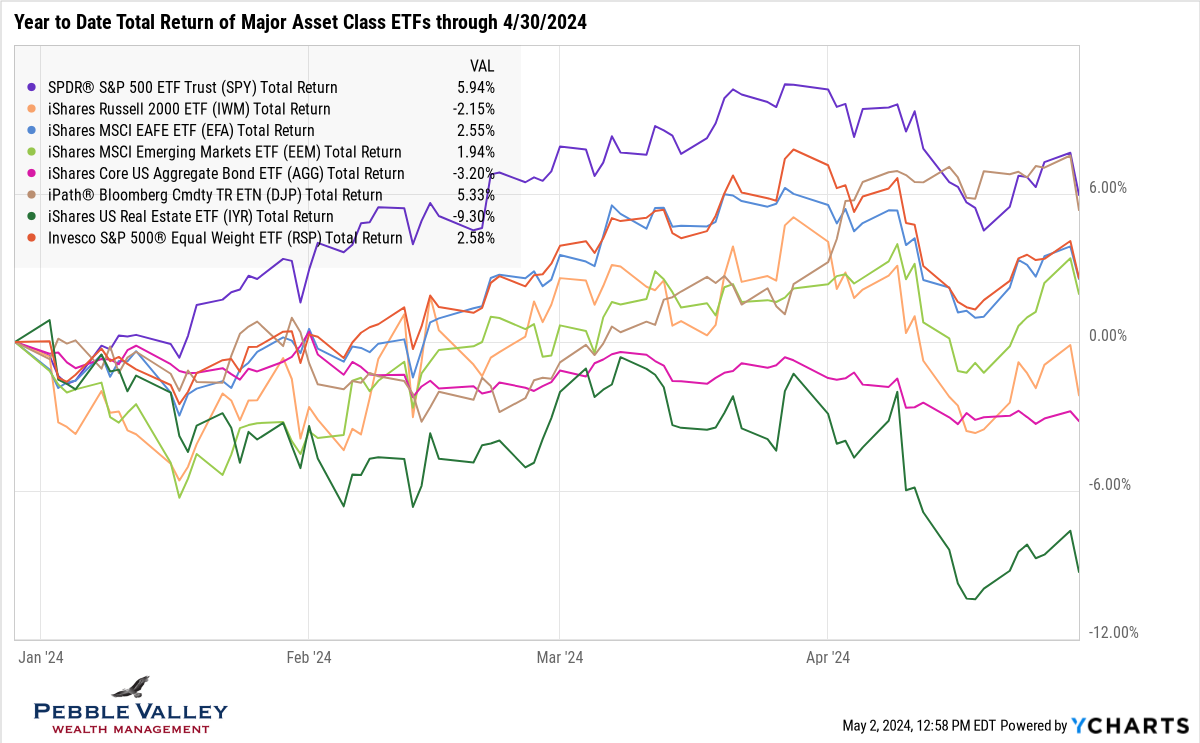
The graph below remains the same with total returns of major asset class ETFs, including the equal-weighted S&P index ETF (ticker RSP). You can see all asset class ETFs were down for the month of April except for the brown line representing commodities. The green line that fell out of bed are the REITs. It is interesting to note the magenta line representing US bonds – “the AGG” – has been negative for almost all of 2024 and is the second worst performer YTD. The Growth v. Value dispersion which dominated 2023 returns is not present so far this year, though a slight nod to better performance for Growth.
Looking at the Treasury Rates chart below you will see rate levels are close to the relative peak levels seen last fall. 3-month TBills are holding at similar levels while the Fed remains on hold. Much of the bond price action in 2024 (and resulting yield moves in opposite direction) is tied to inflation remaining sticky or even creeping back up after falling last year. This has a direct impact on market expectations of Fed rate cuts, which is very tightly linked to 3-month and 2-year rate moves and influences longer maturity rates. Even the TIPS real yield – fixed coupon received IN ADDITION to actual inflation – resumed the march higher. More on that with I-Bonds in my special topic below.
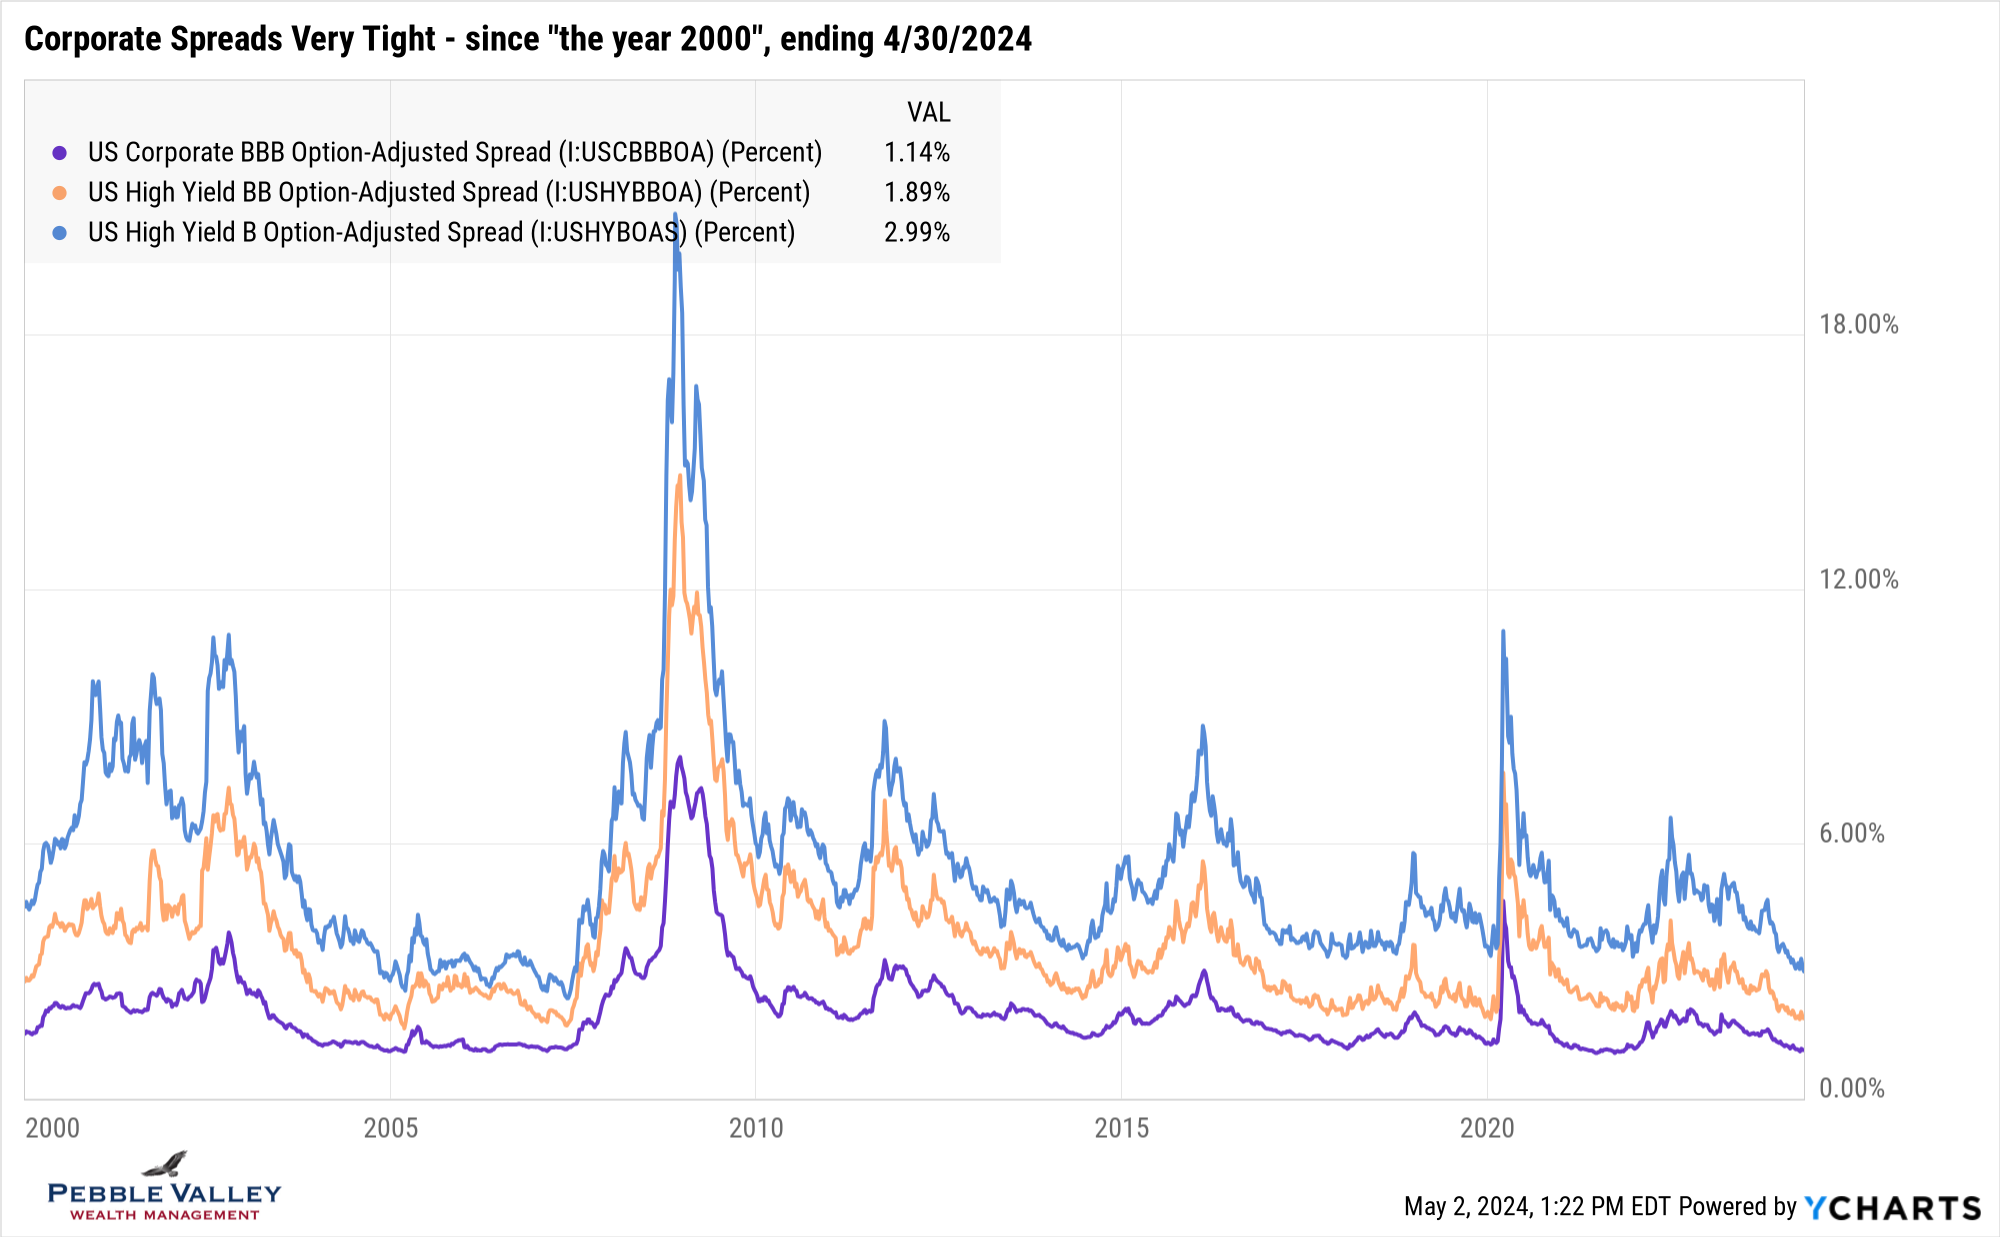
Below the Treasury Rate graph I show corporate credit spreads going back “to the year 2000” (any old-timer Conan fans?!). You can see spread levels – the extra yield paid to own bonds that may not return your money, unlike Treasuries – are very low historically. If the market demands more payment for those worried about being paid back, this will cause corporate bonds and bond funds to lose value, in addition to any treasury rate movements mentioned above. This graph provides a visual for the term “go up in quality” since not getting paid to take extra credit risk right now.

The FOMC concluded their latest meeting on May 1st. They held rates steady as expected. Focus was on whether Chair Powell would mention potential rate hikes given recent hotter inflation readings. He did not. He even said it is unlikely the next move is a hike. After the last GDP report, which saw lower (but positive) growth along with rising inflation, Powell also received a question about stagflation – anemic growth along with inflation. He put cold water on this also, pointing out that growth still remains and inflation, while higher than want, is below 4%. The other thing that got my attention was Powell stated a couple of times the Fed’s intent remains getting inflation down to 2%. There has been talk they may stop in the “mid- to high- 2’s” but clearly he disagrees. The CME Fedwatch Tool shows the implied probability of only ONE 0.25% rate cut by the end of 2024 has risen to just over 40%, well up from less than 5% in early March. Recall there were six to seven rate cuts priced in at beginning of the year.
There was a change in policy however. After past “quantitative easing (QE)” policies where the Fed bought bonds to keep rates lower, the Fed was letting its balance sheet “run off” by NOT reinvesting maturing bonds at a rate of $65 billion Treasuries and $30 billion mortgage-backed securities (MBS). That policy was changed to only $25 billion Treasuries and the same pace for MBS. The stated intent is more related to liquidity and plumbing of the Treasury markets and not more restrictive rate policy – i.e. less QE, but still E and not T for tightening.

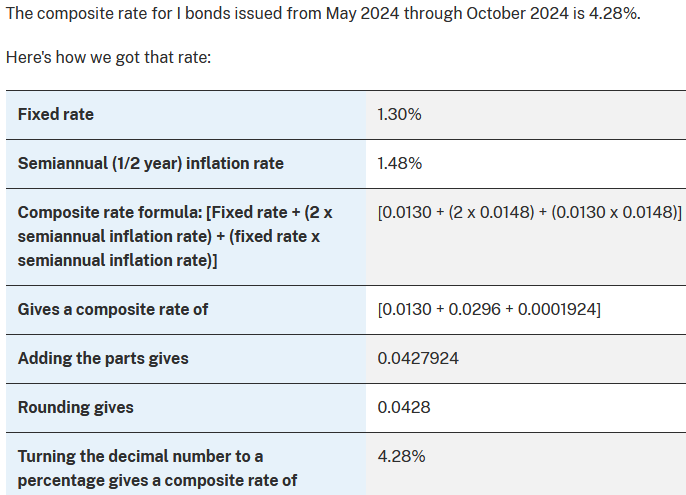
My special topic this month is I-Bonds. You may recall I-Bonds got much attention back in 2022 when the 6-month crediting rate was 9.62% for new deposits! The new crediting rate is 4.28% for new money deposited over the next six months. The inflation component for this cycle is 2.96% but more importantly, the fixed rate component remains at 1.30%, despite real rates falling since the last reset on November 1.
Here is a brief summary of I Bonds. I view these as great “reserve fund” vehicles (provided access to other funds first 12 months) and not a trading vehicle. The fixed rate component is a very important feature to understand and there is a strategy to repurpose I Bonds for those who got all excited about the 9.62% rate but actually locked in a 0% fixed rate for life – until they repurpose. Call us if looking for help.
Brief overview of I-Bonds
- Only available in electronic form on TreasuryDirect
- Maximum contribution PER YEAR is $10,000 per individual (SS#) or entity (Trust or business); the $10k is NOT a lifetime max, just annual contribution
- Crediting rate set every May 1 and November 1; contains both inflation component that applies to all I Bonds PLUS a fixed rate unique to each I-Bond receiving new deposits over the following six months
- Can’t access funds the first 12 months; if withdraw funds during following four years will lose last three months interest
- Interest is taxable at Fed but not state; can choose to recognize taxable interest each year or when sell; most choose the latter but for younger kids we recommend the former
To all the Mothers out there, Happy Mother’s Day. May the appreciation be year-round, but also get to do whatever you wish on your special day! Some may have their babies coming home from college this month. Enjoy the extra time with them.
Posted by Kirk, a fee-only financial advisor who looks at your complete financial picture through the lens of a multi-disciplined, credentialed professional. www.pvwealthmgt.com