

Asset Class Returns - 3/31/2025
This month I will add a few more graphs and a few less words as I highlight things that caught my attention – in addition to the usual graphs.
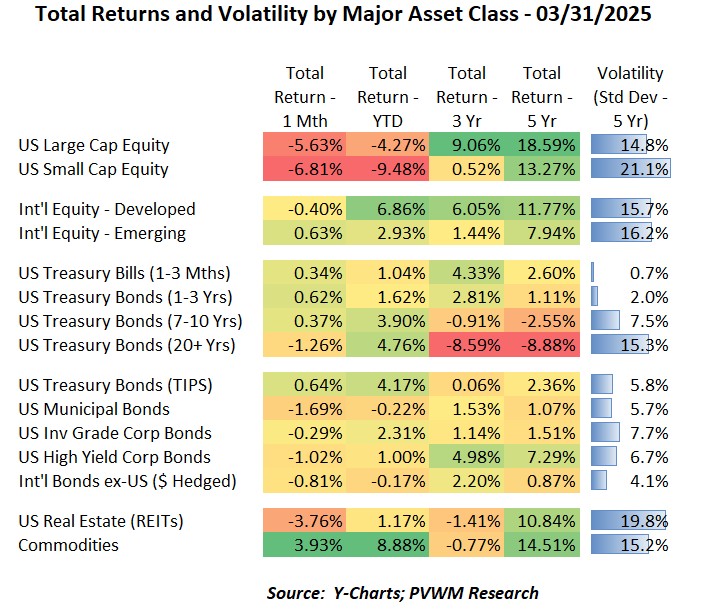
Speaking of usual – we start with the table above. Again this month, US equities were the prominent negatives in the table while most others were flat to down slightly. An exception is Commodities which were up noticeably. Another exception is the long Treasury bond which had a loss of -1.2% after a very strong February. More on bonds later. Last month I highlighted the concentration in the S&P500 (Source: JPM Guide to Markets). The impact of that concentration was noticeable on the way up the past couple years and is equally noticeable on the way down in 2025.
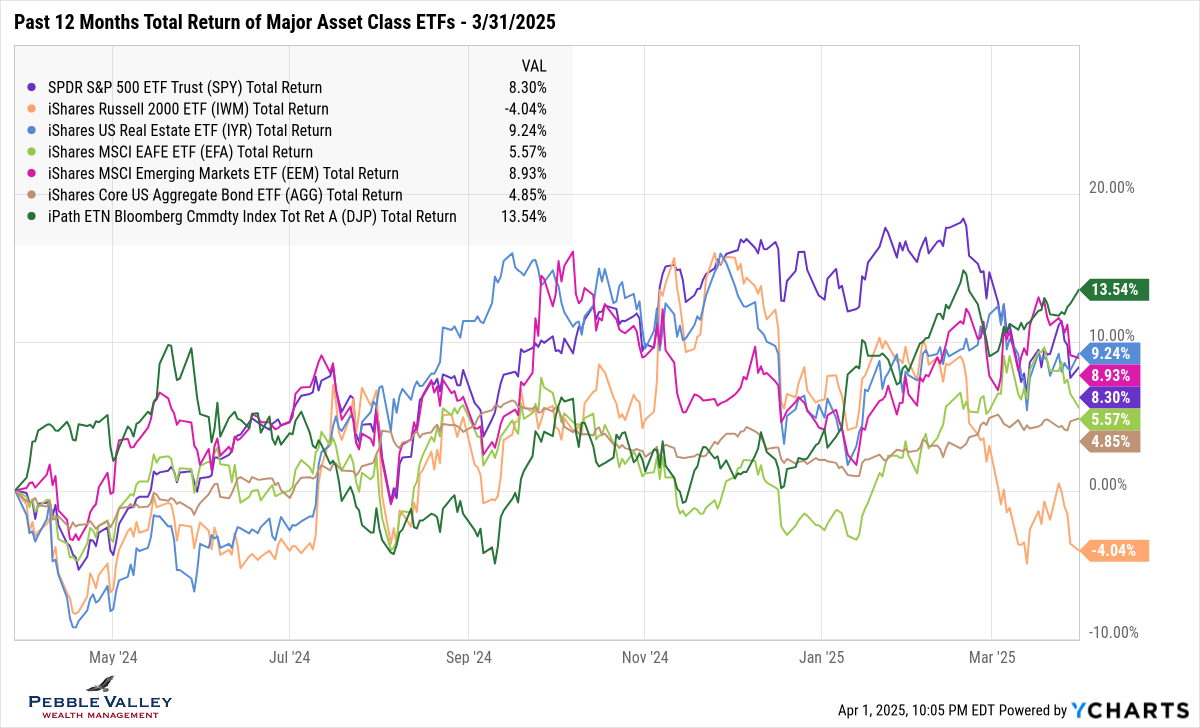
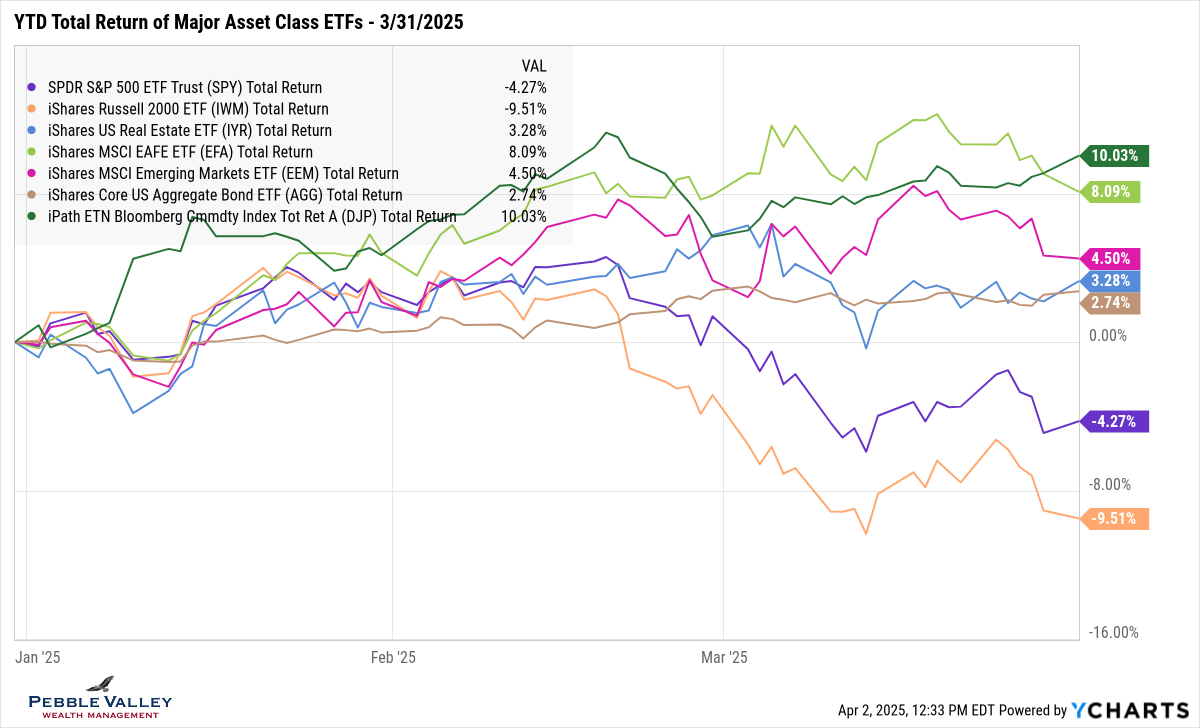
The graph below shows total returns of major asset class ETFs for the past 12 months. Note the top return belongs to Commodities (green line) while the noticeable laggard is US Small Caps (orange line). The remaining asset classes are bunched together. With the one-year context in hand, I then show the same graph on YTD basis to highlight the recent dispersion. You can see International equities – both Developed and Emerging – are outperforming US equities by a sizeable margin.
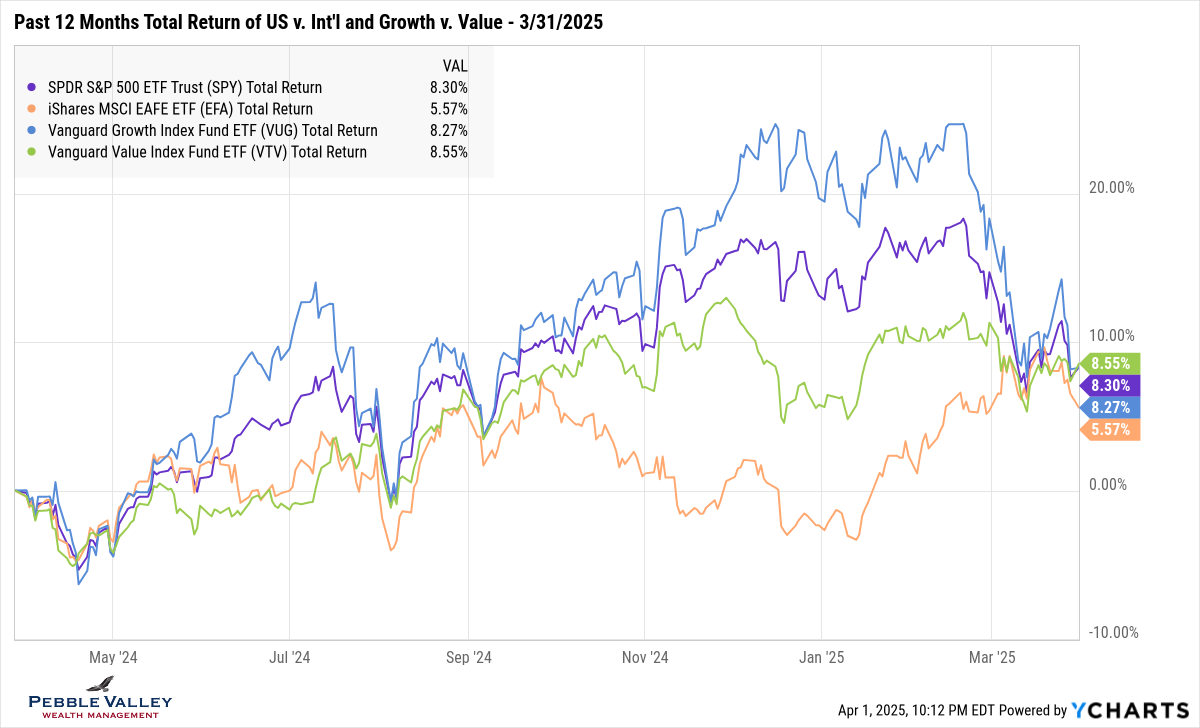
This month I am including a graph of two pairs of equity types over past 12 months – US v. Int’l equity and US Growth v. Value. Int’l equity has done very well this year on the back of more spending plans in Europe and a weaker dollar. It also didn’t have the lofty valuations of US equities so less of an impact from “risk-off” mode. A similar story on relative valuation can be said about Growth v. Value.
On a month-to-month basis, interest rates didn’t move very much, except for the 2-year rate which saw a 0.10% drop as concerns picked up of an economic slowdown. There are many drivers for longer-term interest rates but often a single theme or focus dominates the near term until attention is shifted to another key topic. The current topic is potential recession. The 2-year yield remains below the 3-month TBill but the 10-year yield is almost below as well. Real yields on TIPS remain below 2% for 10-year maturity.
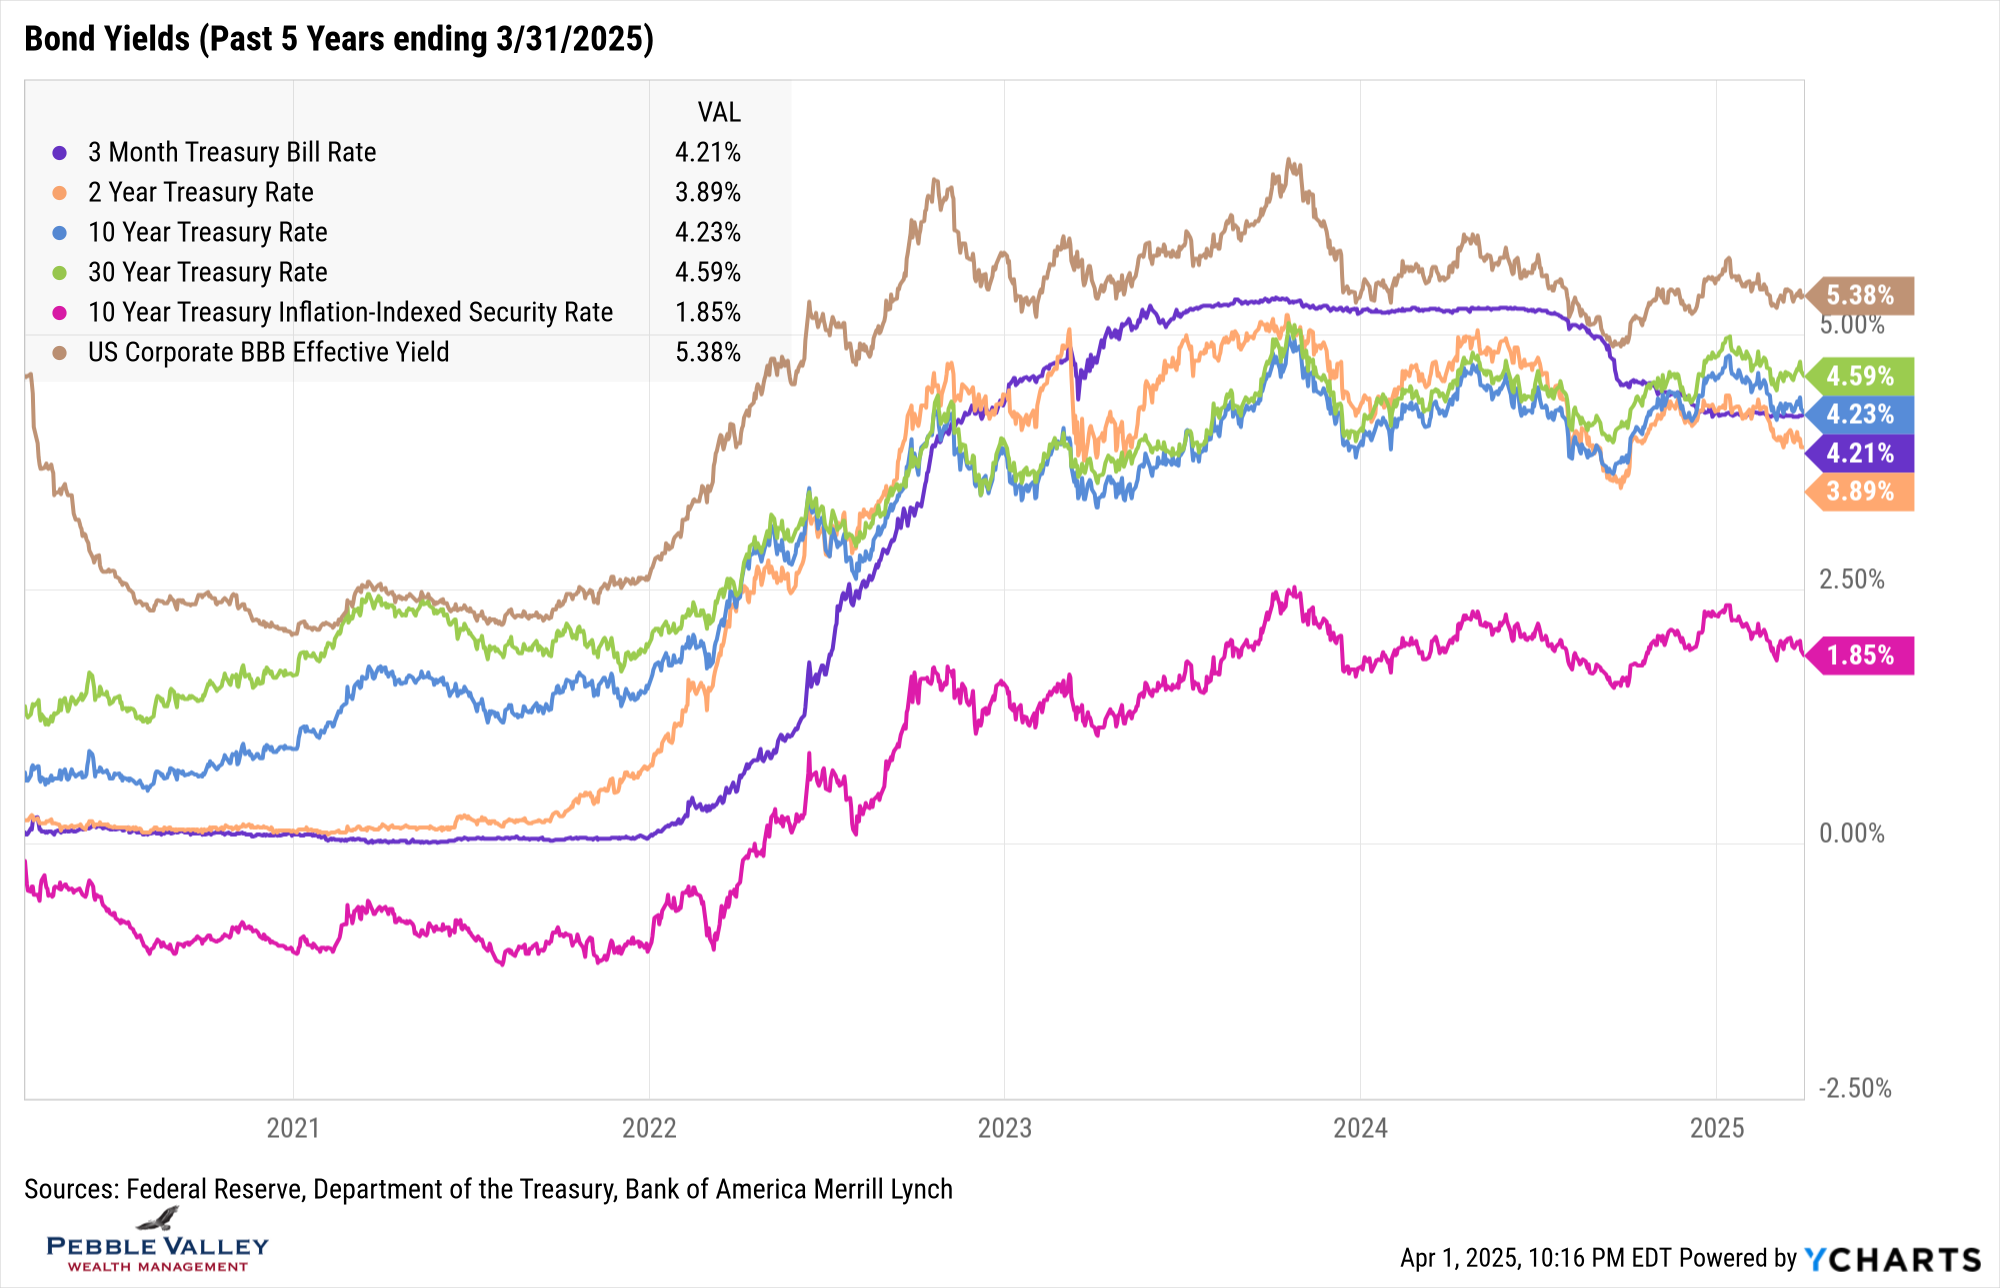
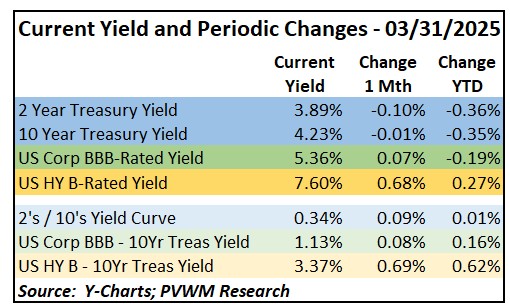
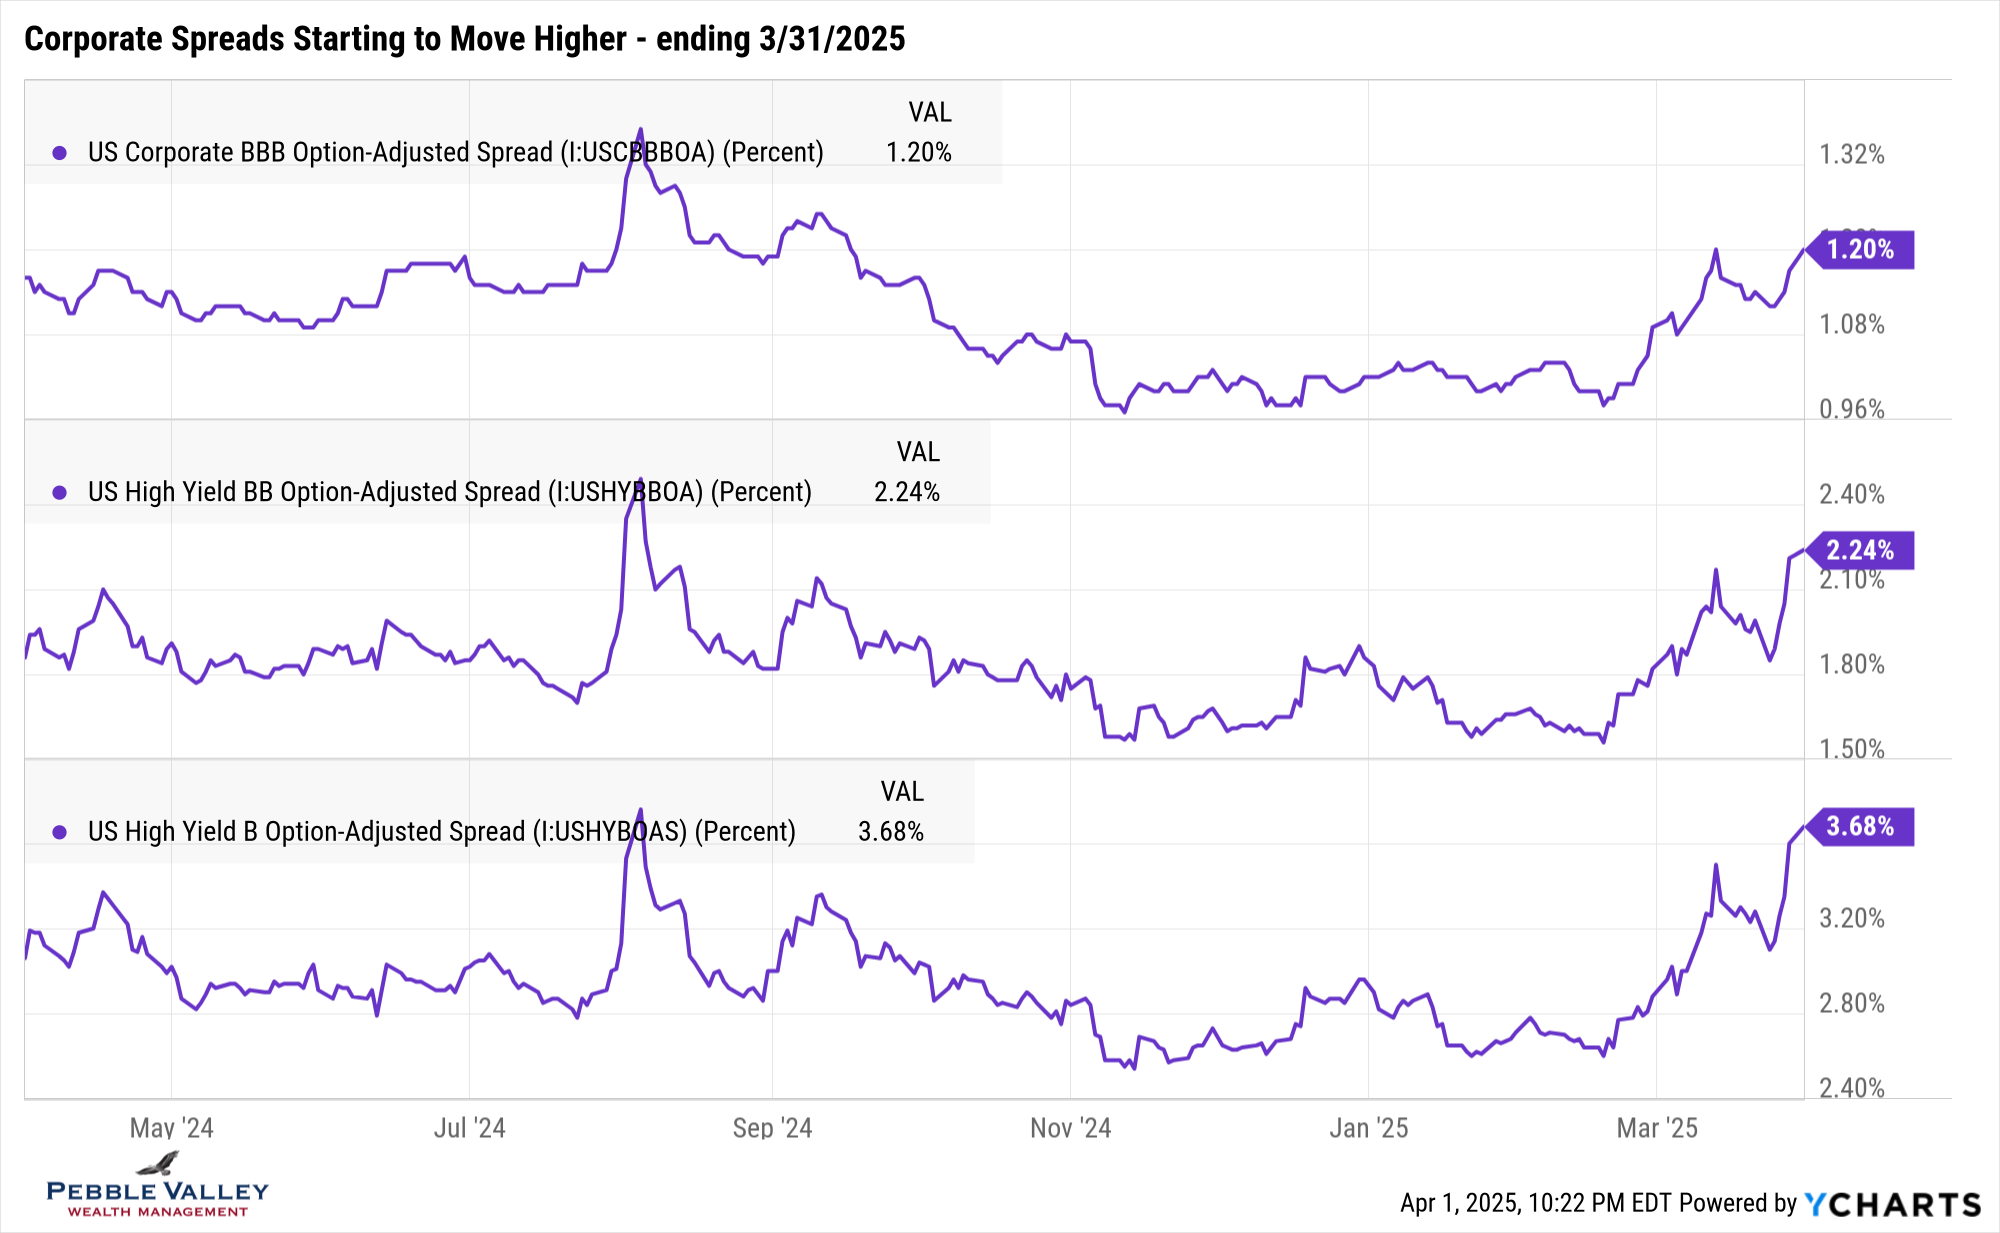
The other thing that got my attention in the bond market is credit spreads. With a longer context spreads remain very tight. However, the past month saw a noticeable widening – especially in lower-rate credits. It is something to be aware of and use the opportunity to go up in quality if you haven’t been there already. This widening credit spread explains why total returns of corporate bond indices are lower than treasuries on the table at the top of blog post.
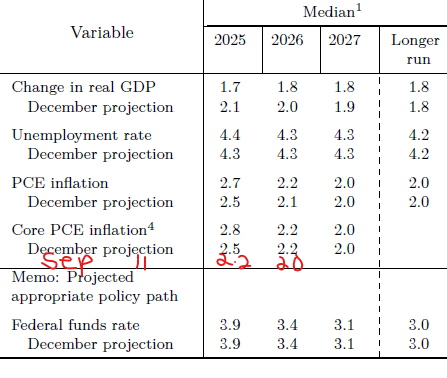
The next FOMC meeting concludes on May 7th. The FOMC kept Fed Funds rate at 4.25-4.50% but did announce they will slow down the balance sheet runoff for Treasuries, only letting $5 billion per month roll off starting April 1 rather than $25 billion. On the margin this will lead to lower rates (higher bond prices) as the Fed will be a buyer of more bonds. They will continue to let $35 billion of agency debt and mortgage-backed securities roll off each month. The FOMC also updated the Summary of Economic Projections. Real GDP estimates were projected to be lower while the unemployment rate looks steady (not recessionary levels!). The surprise came in the PCE inflation projections. Not only did projected Core PCE go up by 0.3% for 2025, that was after a 0.3% increase from the December SEP relative to September. As a reminder, these estimates are the median of 19 Fed officials and not an official estimate from the Fed – but informative. Fed Funds futures are still pricing in three rate cuts in 2025 and now pricing in the fourth cut (which would bring rate down to 3.50 – 3.75%) earlier in 2026. It is hard to see that many rate cuts if the median economic forecasts plays out.
There is no special topic this month beyond watching how much and what type of tariffs will actually be implemented vs. what is negotiated among the parties involved. And while the next major tariff policy will be announced April 2nd, the implementation details and timing won’t all be known on the first day.
According to Tom Skilling, retired WGN weatherman, March has the greatest gain in daylight at 84 minutes during the month for Chicago. But April is the second largest with a 77-minute daylight gain. Let the good times roll!
Have questions? Reach out! We're happy to help.
Posted by Kirk, a fee-only financial advisor who looks at your complete financial picture through the lens of a multi-disciplined, credentialed professional. www.pvwealthmgt.com